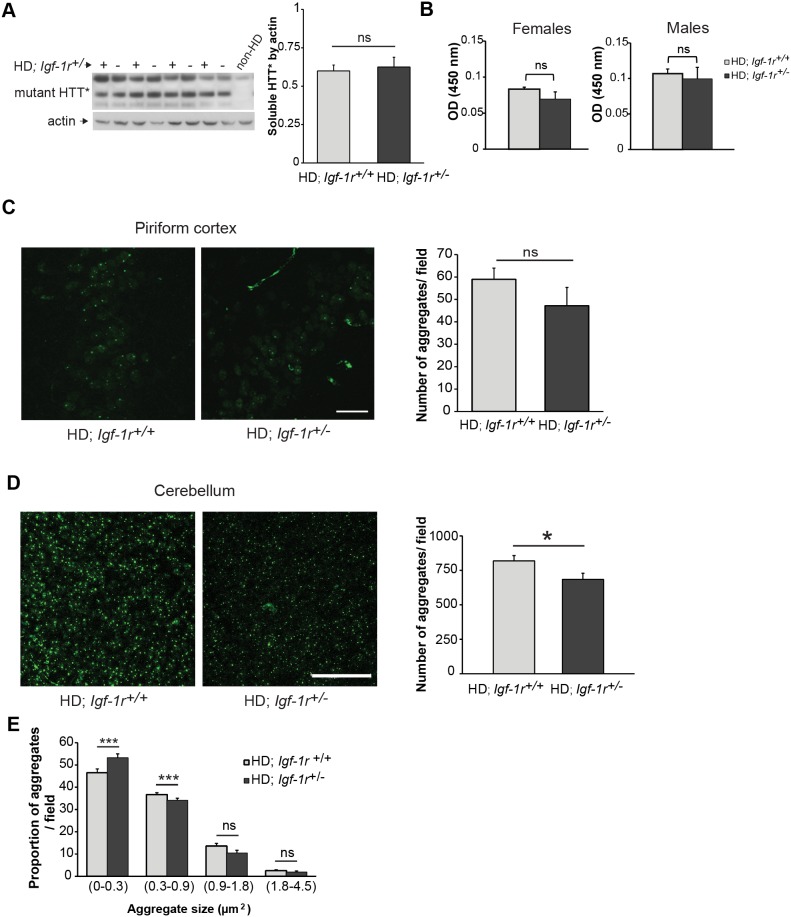
Figure 4. Igf-1r hemizygosity has minimal effect on the levels of mutant huntingtin protein.
A. Female half-brain homogenates at 12 weeks of age of the indicated genotypes were subject to western blot analysis to measure soluble mutant huntingtin levels (HTT*). The corresponding graph represents the comparison of the densitometry analysis of HTT* levels relative to actin between HD; Igf-1r+/+ and HD; Igf-1r+/− groups (n = 4 per genotype; p = 0.67). B. Using Microsens Aggregate Purification ELISA we measured the mutant HTT aggregates in homogenised cerebellums of 12 weeks old male and female HD mice (n = 4 per group and gender). No significant differences were found between female HD (p = 0.29) or male HD mice (p = 0.69). C. Quantification of huntingtin inclusions in the piriform cortex. Brain slices obtained from 13 weeks old female mice of the indicated genotypes were stained to detect the mutant huntingtin aggregates. Confocal images of the piriform cortex were obtained and analysed as detailed in the methods section. (n = 4 per HD group; p = 0.06). Scale bar represents 25 µm D. Quantification of huntingtin inclusions in the cerebellum of HD female mice. Representative images of confocal projections from the granular layer of cerebellum containing mutant huntingtin aggregates. The quantification of the total number of mutant huntingtin inclusions in the cerebellum shows a modest decreased in the number of inclusions found in the HD; Igf-1r+/− group compared to the HD; Igf-1r+/+ (n = 6 per HD group; p = 0.019). Scale bar represents 50 µm. E. Automated quantification of images from D according to aggregate size reveal an increase in the percentage of small-size aggregates (0–0.3 µm2) coupled with a decreased in the percentage of medium-sized aggregates (0.3–0.9 µm2) in HD; Igf-1r+/− cerebellum compared to controls (p<0.001). Data are expressed as mean ± 1×s.e.m. *P<0.05; **P<0.01; ***P<0.001. ns = non-significant.

