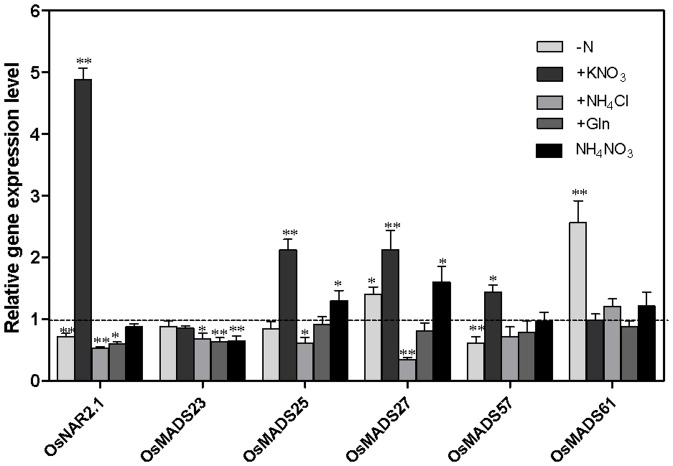
Figure 2. Effect of different N sources on the expression of five ANR1-related genes in rice roots.
Rice seedlings were grown in liquid culture for 14 days with 2.88 mM KNO3 as the sole nitrogen source and then N starved for 3 d. CK, continuous N; −N, starved for 3 d; +KNO3, resupplied with 2.88 mM nitrate; +NH4Cl resupplied with 2.88 mM NH4 +; and +Gln, resupplied with 2.88 mM glutamine; +NH4NO3, resupplied with 1.44 mM NH4NO3. The value of related genes were normalized to its CK control respectively. The mRNA of OsActin was used as the reference. Error bars represent SE. LSD values were calculated at the probability of either 5% (*, p<0.05) or (**, P<0.01).

