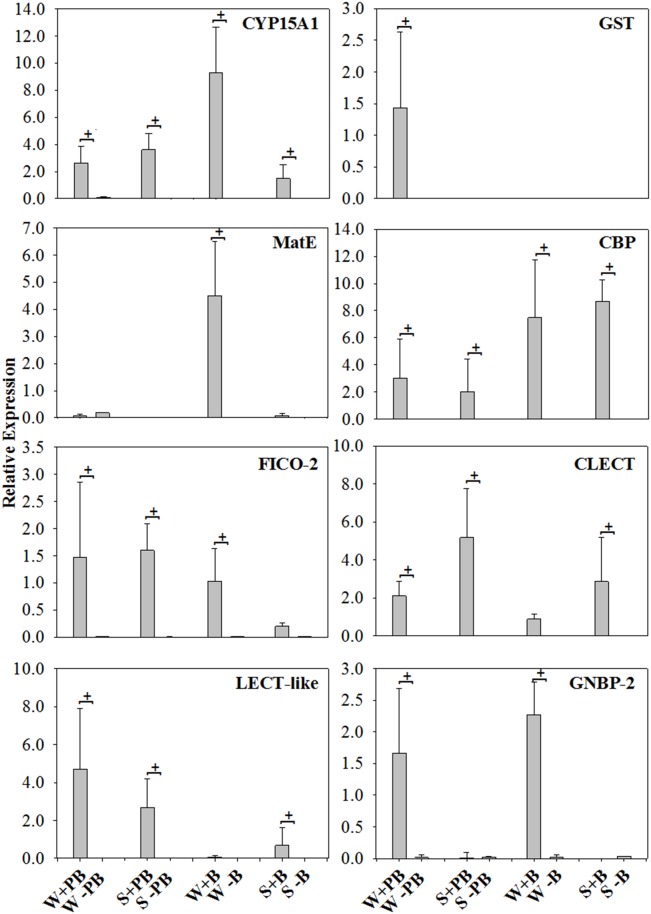
Figure 1. Constitutive and induced expression of target gene amplicons.
The y-axes denote relative expression in R units averaged over three colonies (note that the ranges of y-values vary across graphs). The x-axes denote caste (W = worker, S = soldier) and treatment type (+PB = fed with 0.5% Phenobarbital, +B = septic injury with E. coli/P. termitis and -PB/-B = untreated control showing constitutive expression). ‘Missing’ columns have a relative expression of<0.01. + marks significant induction. There was no induced expression observed for either CYP450 or DSCAM (not shown).

