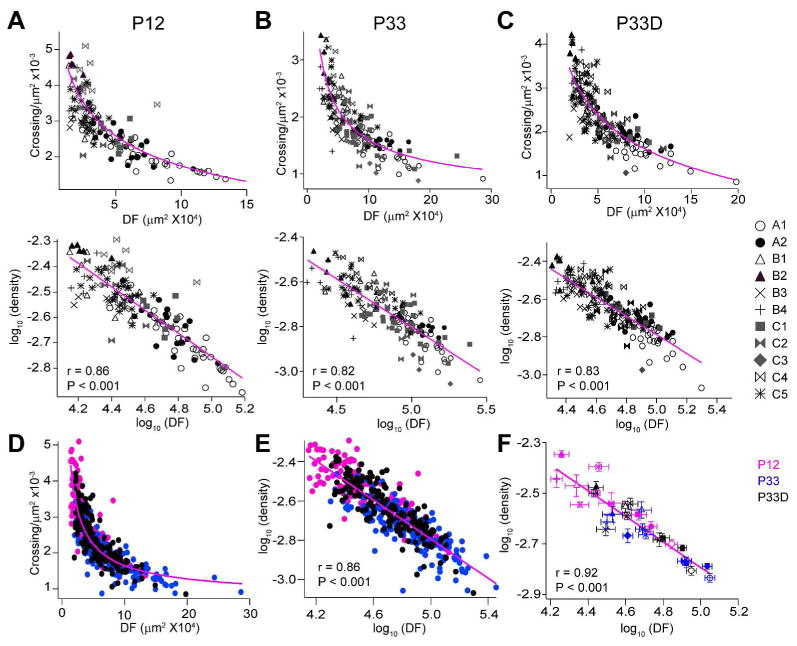
Figure 2. A general structural design principle directs the vision dependent dendritic refinement of RGCs.

(A-C top) Plots of coverage areas versus dendritic densities (measured as number of crossings per unit DF area) of different RGCs types in P12 (A top), P33 (B top) and dark-reared P33 (P33D) mice (C top). Solid lines represent decreasing exponential regressions. (A-C bottom) Plots of coverage areas versus arbor densities in logarithmic spaces of diverse RGC types in P12 (A bottom), P33 (B bottom) and P33D mice (C bottom). Solid lines represent linear regressions. (D) Plots of coverage areas versus dendritic densities of RGCs in mice of different ages and rearing conditions. Solid line, decreasing exponential regression. (E) Plots of coverage areas versus dendritic densities of RGCs in mice of different ages and rearing conditions in a logarithmic space. Solid line, linear regression. (F) The coverage areas and the dendritic densities were first averaged based on cell types and then plotted in a logarithmic space. The relationship between these two morphological features follows a scaling law regardless of the cell types, developmental stages and rearing conditions.
