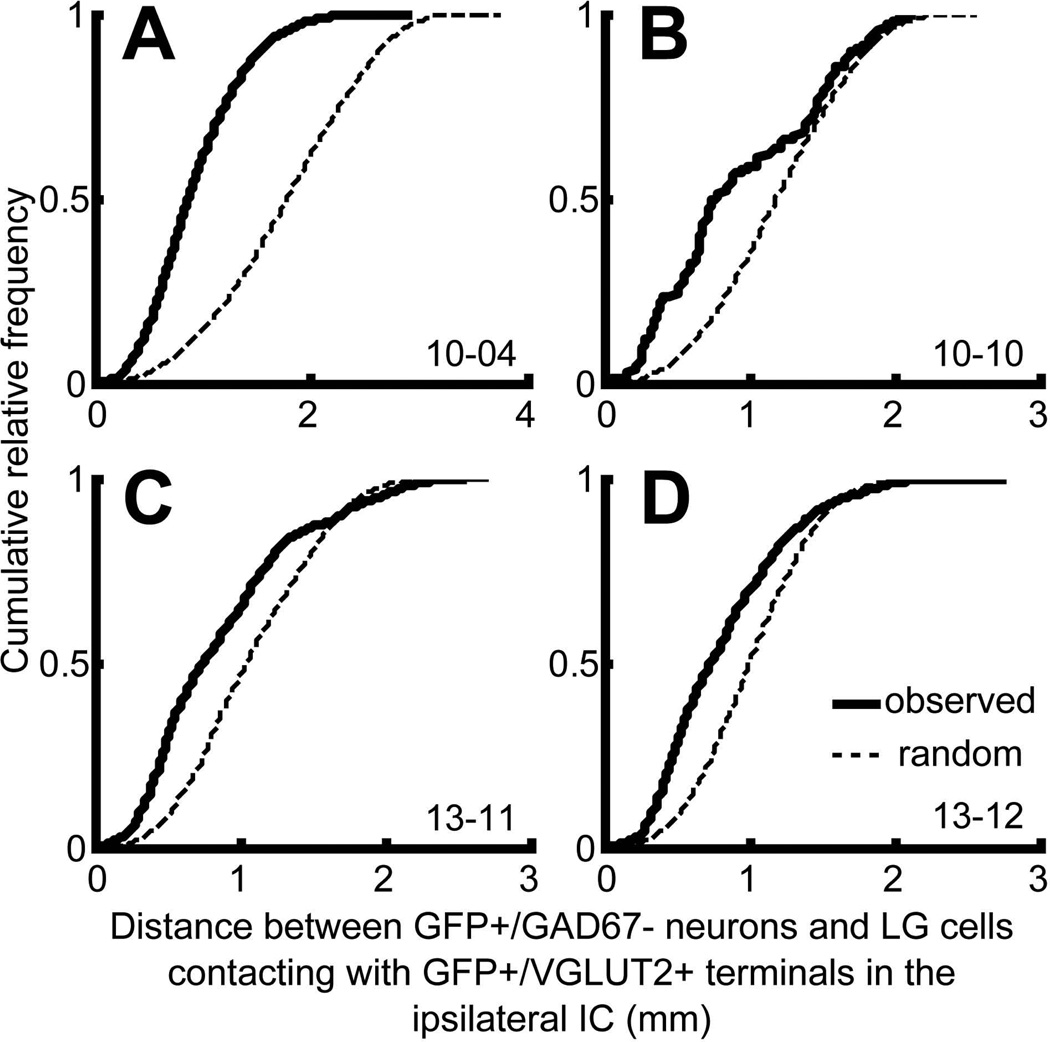
Figure 4.
Cumulative histograms of distance between ipsilateral, non-GABAergic GFP+ neurons and LG neurons receiving GFP+/VGLUT2+ terminals (thick lines). Dotted lines indicate cumulative histograms of distance between GFP+ neurons and randomly re-distributed LG cells. The observed distributions (thick lines) were significantly different from random distribution (dotted lines) (P < 0.001, Two-sample Kolmogolov-Smirnov test).

