
Figure 2.
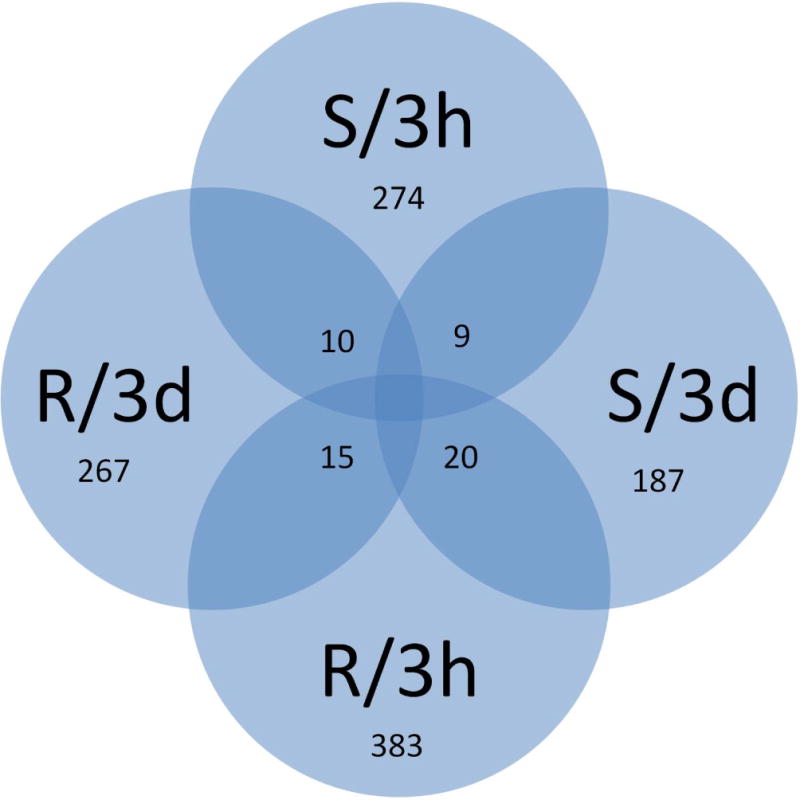
Venn diagram showing number and distribution of differentially expressed transcripts (DETs) between D2S3 and/or Moyo-D strains at 3 hr and/or 3 days after infection with dengue virus. The four samples are shown as S/3h, S/3d, R/3h and R/3d, where S and R represents the susceptible (D2S3) and the refractory (Moyo-D) strains respectively, and 3 h and 3 d represent the two post-infection time points (i.e. 3 h and 3 days), respectively. The numbers of DETs that are responsive to dengue infection exclusively in a specific strain at specific times are indicated. For example, 274 transcripts were up-regulated in the susceptible strain (or down-regulated in the refractory strain) at 3 hr after infection, whereas 267 transcripts were up-regulated in the refractory strain (or down-regulated in the susceptible strain) at 3 days after infection. The numbers shown as shared between samples represent DETs which are up-regulated in more than one strain or time point. For example, total 10 DETs were up-regulated in the susceptible strain at 3 h (or down-regulated in the refractory strain), but the same DETs were up-regulated in the refractory strain at the 3 day time point (or down-regulated in the susceptible strain).