
Figure 3.
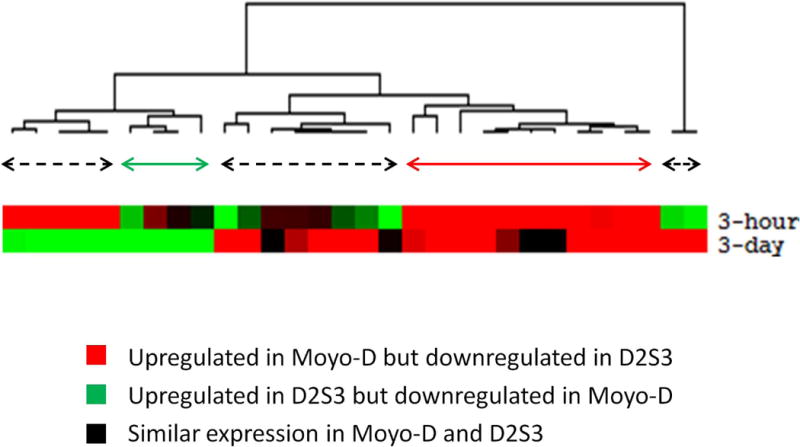
Hierarchical cluster of transcripts (Online Resource 3) based on differential expression at both post infection time points in either D2S3 or Moyo-D strains. The cluster tree shows different groups of transcripts (marked by colored horizontal arrows) that show similar expression patterns between the two strains and the two time points. Below the horizontal line are the self organizing maps of expression cluster of the transcripts and the color codes of the map are described below that. The color of horizontal arrows indicates the groups for the different expression patterns.