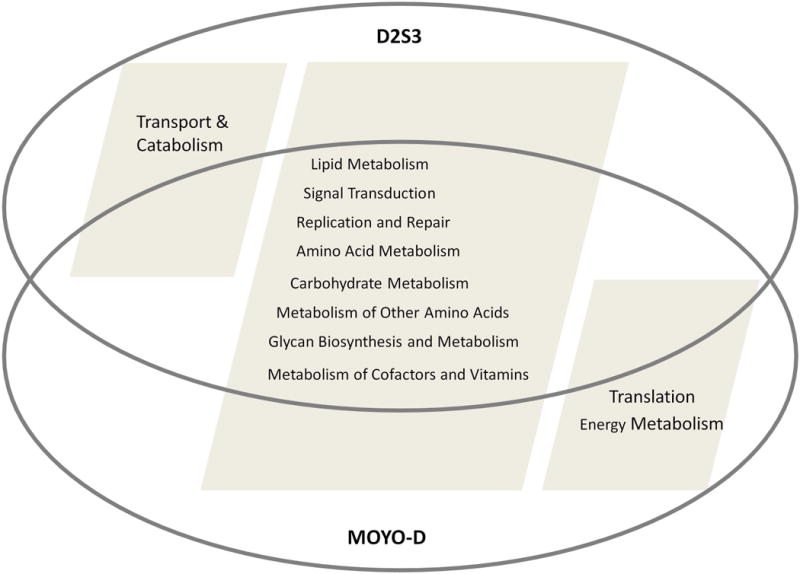
Figure 4.

Hypergeometric distribution of genes which are differentially expressed between Moyo-D vs. D2S3 (current investigation) and Moyo-D vs. Moyo-S (Chauhan et al. 2012). The Venn diagram shows the number of up-regulated transcripts in susceptible (blue color) versus refractory strain (red color).
