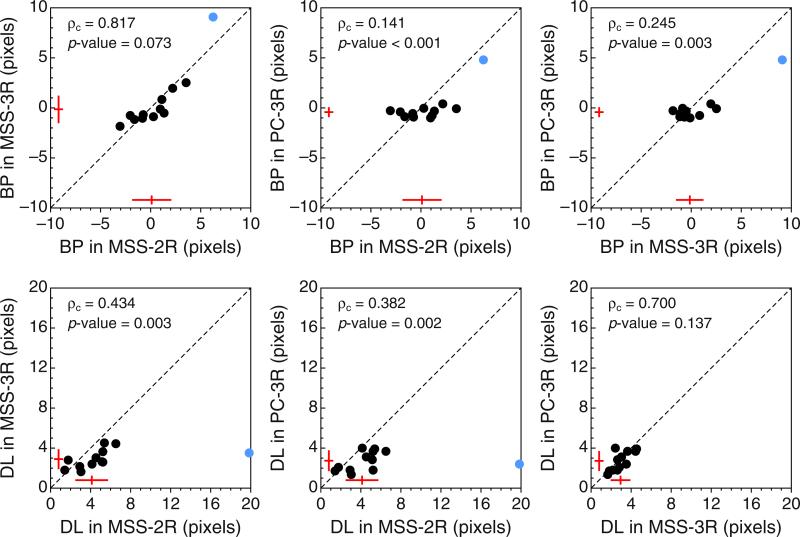
Fig. 8.
Scatterplots of estimated bisection points (BPs, top row) and estimated difference limens (DLs, bottom row) across variants of the landmark task. Estimates from Observer 11 are excluded (see Appendix C). The inset at the top left of each panel shows the value of the concordance correlation coefficient ρc and either the p value associated with the Bradley–Blackwood (1989) test for equality of means and variances (top row) or the p value associated with a paired-samples t test (bottom row). The sketches near the bottom and left axes in each panel indicate the mean and standard deviation of the data along the corresponding dimension. The stray, colored data point plotted in each panel was excluded from all computations (see the text). Color is available only in the online version

