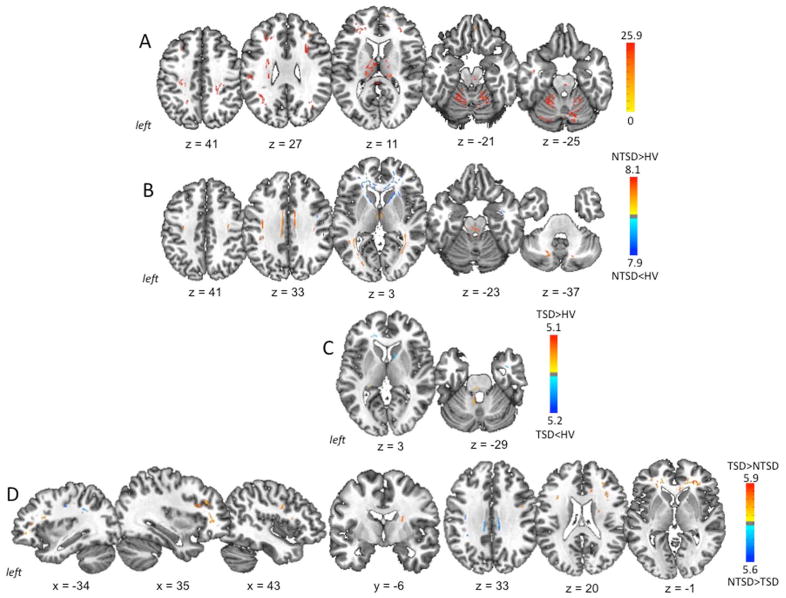
Figure 2. White matter abnormalities in TSD and NTSD.
(A) Initial analysis of variance (ANOVA) comparing fractional anisotropy (FA) as a measure of white matter integrity and coherence between TSD, NTSD and healthy controls. (B) Abnormal FA in the NTSD group compared to healthy subjects. (C) Abnormal FA in the TSD group compared to healthy subjects. (D) Differences in FA between TSD and NTSD groups. Brain abnormalities are shown on a series of axial, sagittal and coronal sections in the standard MNI space. The corresponding coordinates of peak changes are given in the Table 2. The color bars represent F score (A) and t scores (B, C, D), respectively.

