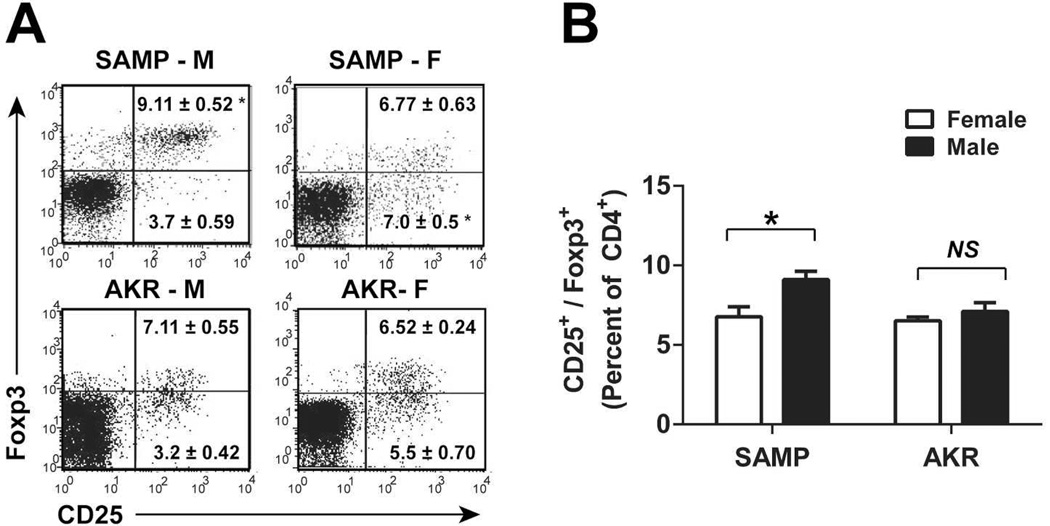
Figure 2. Treg frequency is decreased in SAMP-F compared to SAMP-M.
(A) Representative FACS histograms show expression of CD25 and Foxp3 among CD4-gated lymphocytes from MLN (mice ≥10 wks). (B) Quantitation of results from (A). Percentages of CD25+/Foxp3+ T cells are expressed as mean ± SEM (*p<0.01, n=8–14/group).

