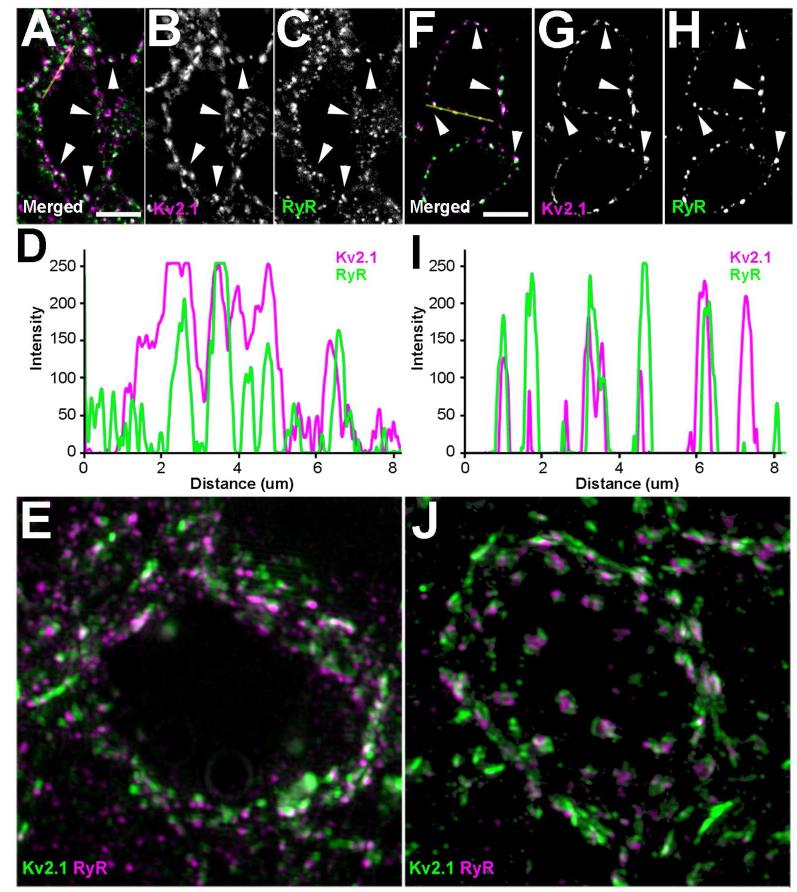
Figure 2.
Kv2.1 clusters are juxtaposed to clusters of RyR in the mouse brain. Mouse brain sections were double immunofluorescence labeled for Kv2.1 (magenta) and RyR (green). Images in panels A-C and F-H were acquired using an epifluorescence microscope equipped with an ApoTome. Yellow lines in A and F represent line traces of fluorescence intensities depicted in D and I respectively. Line traces were generated using the plot profile function in ImageJ for each channel. High-resolution images in panels E and J were acquired with Zeiss Elyra system (SR-SIM) and Z-stacks were reconstructed using Zen software. A-C: Single optical section of CA1 pyramidal neuron. A: Merged image of double immunofluorescence labeling. B: Labeling for Kv2.1. C: Labeling for RyR. E: CA1 pyramidal neuron imaged using SR-SIM. F-H: Single optical section of a striatal MSN neuron. F: Merged image of double immunofluorescence labeling. G: Labeling for Kv2.1. H: Labeling for RyR. H: Striatal MSNs imaged using SR-SIM. White arrowheads indicate prominent examples of juxtaposed clusters of Kv2.1 and RyR. Scale bar in panel A is 5 μm and is for panels A-C. Scale bar in panels E, J are 1 μm. Scale bar in panel F is 5 μm and is for panels E-G.

