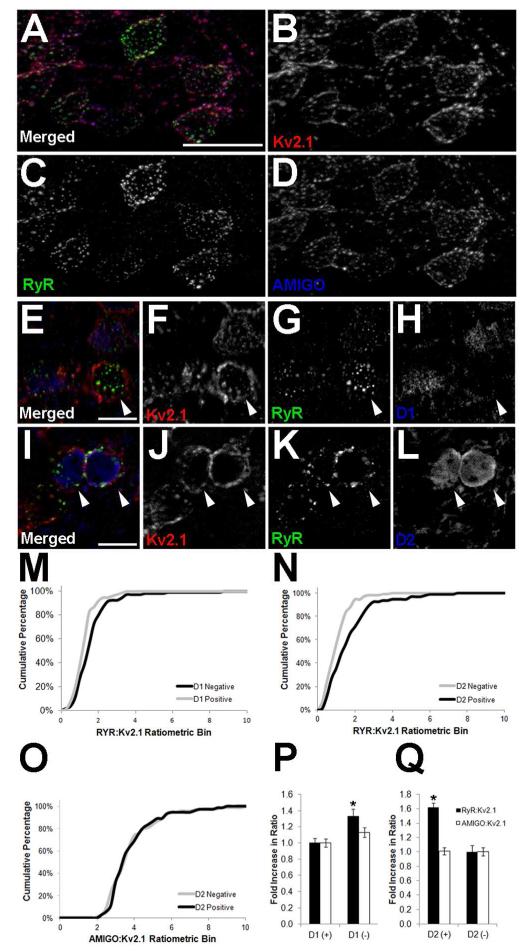
Figure 5.
Indirect pathway striatal MSNs have higher levels of RyR labeling. Mouse brain sections were multiple immunofluorescence labeled for Kv2.1 (red) and RyR (green), and single optical sections were acquired using an epifluorescence microscope equipped with an ApoTome.. A-D: Wild type, labeling for AMIGO-1 shown in blue. In panels E-L, GFP labeling in shown in blue for E-H: EGFP-D1 transgenic mice, or I-L: EGFP-D2 transgenic mice. Scale bar in panel A is 20 μm, and is for panels A-D. Scale bars in panels E and I are 10 μm and are for panels E-H and I-L, respectively. White arrowheads indicate D1−/D2+ (indirect pathway) MSNs. Panels M-Q: Fluorescence intensities were measured from single optical sections taken at 20× using Adobe Photoshop. Cumulative percentages in panels M and N show the RyR:Kv2.1 ratios in the EGFP-D1 and EGFP-D2 mouse striatum, respectively. Panel O shows the AMIGO-1:Kv2.1 ratio in D2+ and D2− MSNs in the EGFP-D2 mouse striatum. Black lines represent D2+/D1− (indirect pathway) MSNs and gray lines represent D2−/D1+ (direct pathway) MSNs. P, Q: Average ratios RyR:Kv2.1 (black bars) and AMIGO-1:Kv2.1 (white bars) ratios from the striatum of P: EGFP-D1, and Q: EGFP-D2 mice. D1+ cell values were used to normalize for corresponding D2 measurements in each independent sample. Data are mean ± SEM (n>150 per group). *p<0.01 versus D2 measurements.

