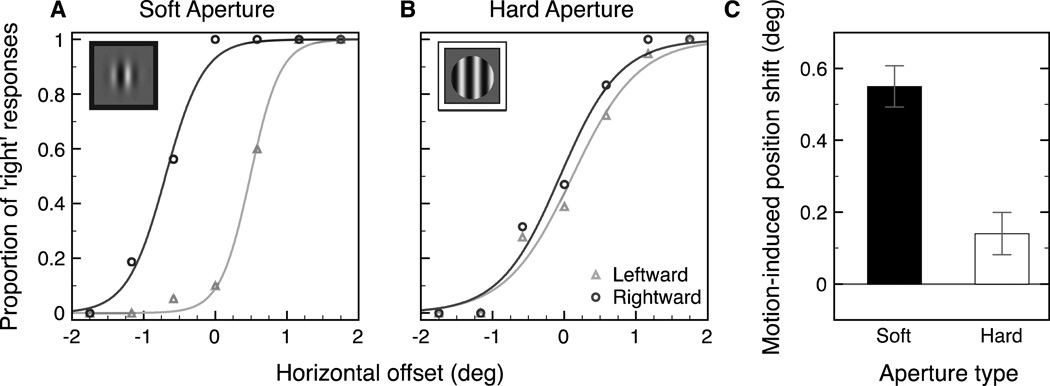
Figure 5.
Example pair of psychometric functions from one subject for the soft aperture condition (A) and the hard aperture condition (B). The x-axis shows the horizontal offset of the central target relative to the two flankers (− left, + right). The y-axis shows the proportion of responses that the target was to the right of the two flankers (triangles: leftward motion, circles: rightward motion). PSEs were calculated individually for each subject and then averaged across all observers for each motion and aperture condition. The motion-induced position shift (C) was calculated as half the difference between the PSEs of the two psychometric functions. Error bars represent bootstrapped 95% confidence intervals.

