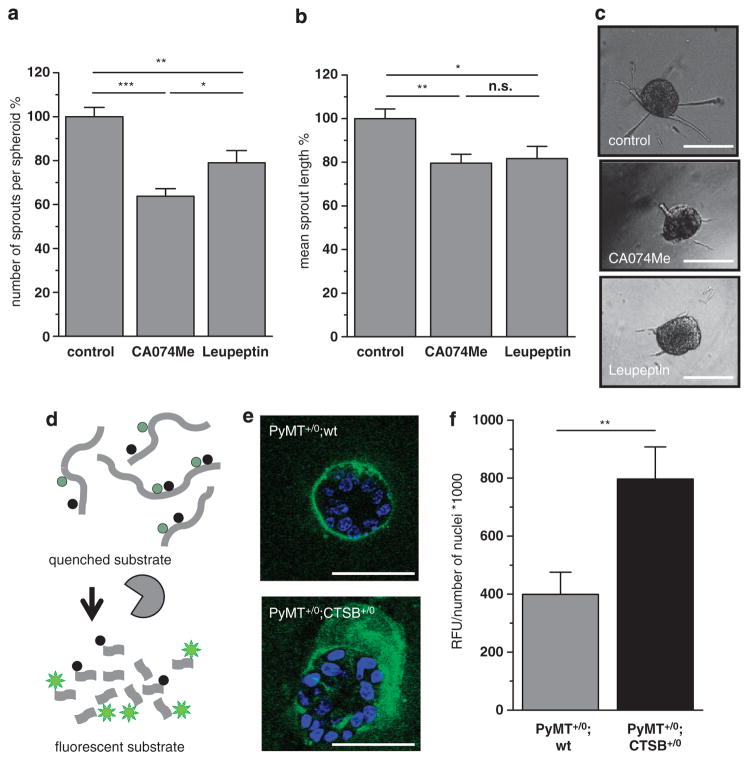
Figure 2.
Invasiveness of primary PyMT tumor spheroids and matrix degradation. (a, b) Effect of protease inhibition on average number of sprouts per spheroid and mean sprout length. PyMT +/0;wt spheroids were grown in collagen I for 24 h, inhibition of CTSB by CA074Me (10 μM), broad spectrum protease inihibiton by Leupeptin (10 μM). A total of 153, 190 and 170 spheroids, in the control-, CA074Me- and Leupeptin-group, were analyzed in 3–5 independent assays. Quantitative values represent mean ± s.e.m.; NS, not significant, *P<0.05, **P<0.01 and ***P<0.001 by ANOVA and post hoc Tukey-test. (c) Representative phase contrast images of tumor spheroids. Scale bars indicate 100 μm. (d) Schematic principle of proteolysis detection with dye-quencher (DQ)-labeled substrate collagen IV. (e) Representative pictures of tumor spheroids of primary PyMT +/0;wt or PyMT +/0;CTSB +/0 tumor cells grown in reconstructed basement membrane for 6 days. Pictures are overlays of 10 confocal planes, scale bars indicate 50 μm. (f) Quantification of fluorescence emission upon substrate cleavage detected by confocal imaging.

