Figure 1.

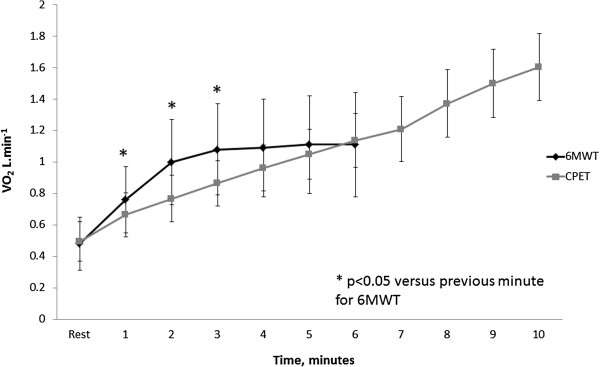
Oxygen uptake (VO2) profile during the six-minute walk test. Data are mean and standard deviation. * represents significant difference compared to previous minute on 6MWT.

Oxygen uptake (VO2) profile during the six-minute walk test. Data are mean and standard deviation. * represents significant difference compared to previous minute on 6MWT.