
Figure 3.
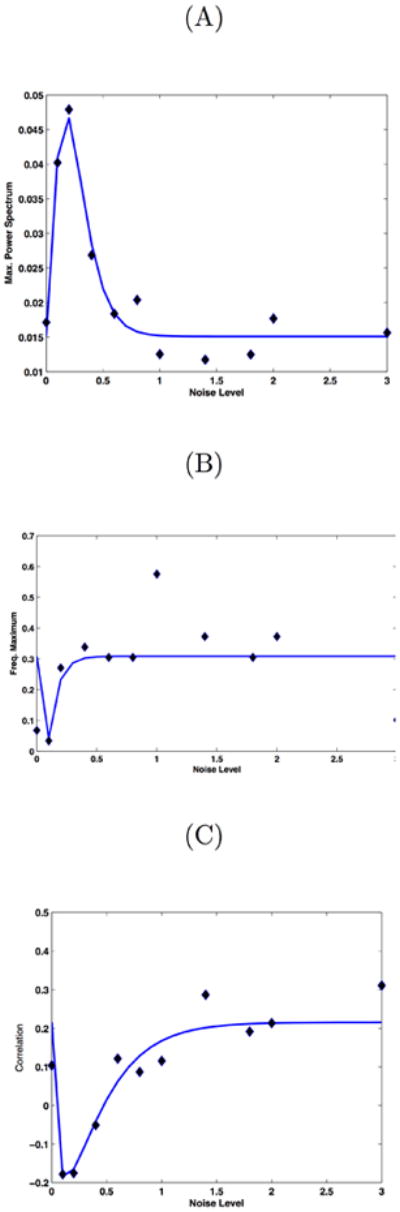
(A): Maximum of the power spectrum peak of the signal given by differences between the level of synchronization between both communities versus the noise level (variance). (B): Maximum in the power spectrum of the signal given by differences between the level of synchronization between both communities versus the noise level. (C): Correlation between the level of synchronization between both communities versus the noise level. Note the stochastic resonance effect that for the same level of fluctuations reveals the optimal emergence of 0.1 Hz global slow oscillations and the emergence of anticorrelated spatio temporal patterns for both communities. Points (diamonds) corresponds to numerical simulations, whereas the line corresponds to a nonlinear least-squared fitting using an alpha-function.