
Figure 4.
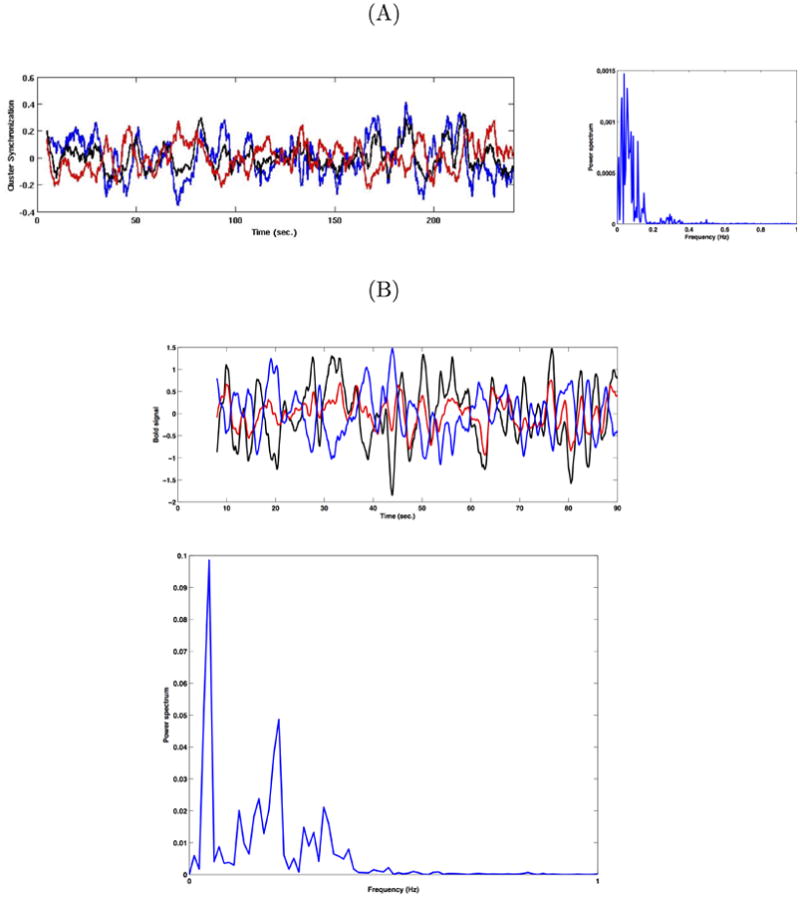
(A) Left: Level of synchronization for each of the two individual communities(community 1: black, community 2: red, difference: blue). Right: Power spectrum of the signal given by differences between the level of synchronization between both communities. (B) Left: BOLD signal for each of the two single communities (community 1: black, community 2: red, difference: blue). Right: Power spectrum of the BOLD signal given by the differences between the level of BOLD signal between both communities.