
Fig. 3.
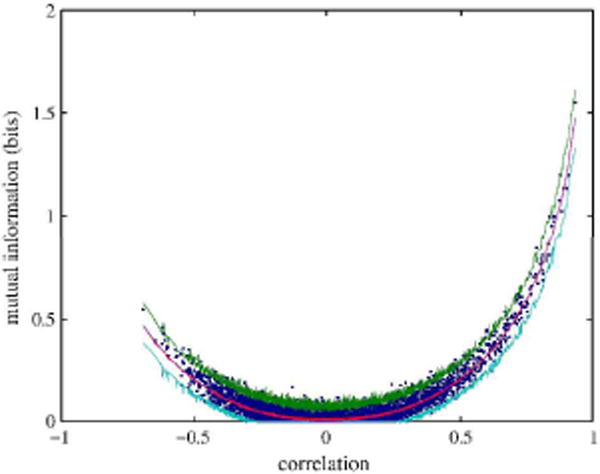
Mutual information as function of correlation in an example dataset. The session with the most non-Gaussianity is depicted. Each blue dot corresponds to MI of one parcel pair; red (light blue, green) lines correspond to mean (1st percentile, 99th percentile) of the surrogate distribution. The purple line shows the theoretical mutual information of an exactly Gaussian distribution with the given correlation IGauss(r)—it is not well visible as it closely matches the mean of the surrogate distribution.