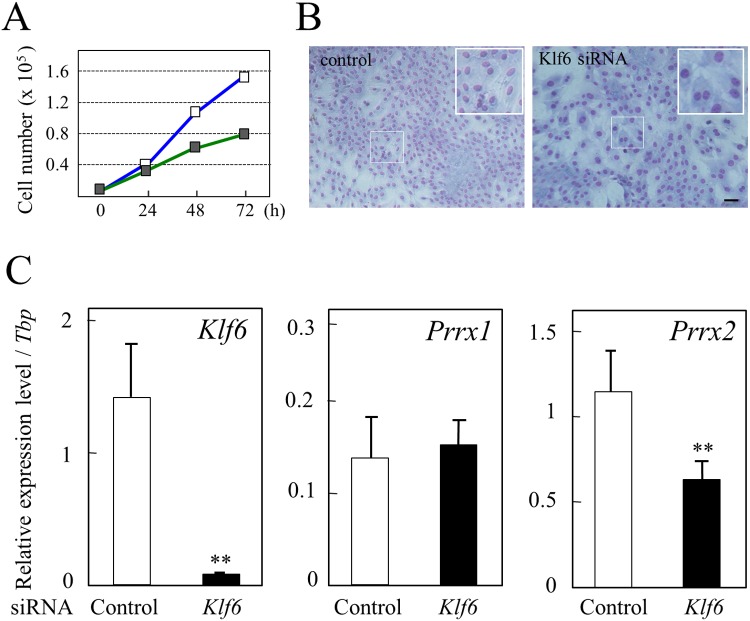
Fig. 4.
Knockdown analysis of the Klf6 mRNA level using siRNA. A: The Klf6 mRNA level was knocked down for TtT/GF cells by transfection of Klf6 siRNAs, and cell proliferation was measured. The respective cell numbers of the control (open boxes) and siRNA-transfected cells (closed boxes) were measured. Data are shown as means ± SD for two independent experiments. B: Microscopy observation of cells after 72 h of culture. Upper and lower panels show photographs of the control and siRNA-transfected cells, respectively. An enlarged image of the boxed area is shown at the upper right. Scale bars: 100 μm. C: Real-time PCR was performed for Klf6 (left panel), Prrx1 (middle panel) and Prrx2 (right panel) using total RNAs prepared from cells cultured for 24 h after transfection. All quantified data are shown as the relative expression level against that of TATA-box binding protein (Tbp). Open and closed bars indicate data of cells transfected with control siRNA and Klf6 siRNA, respectively. Asterisks indicate statistical significance by Student’s t-test (**P<0.01).

