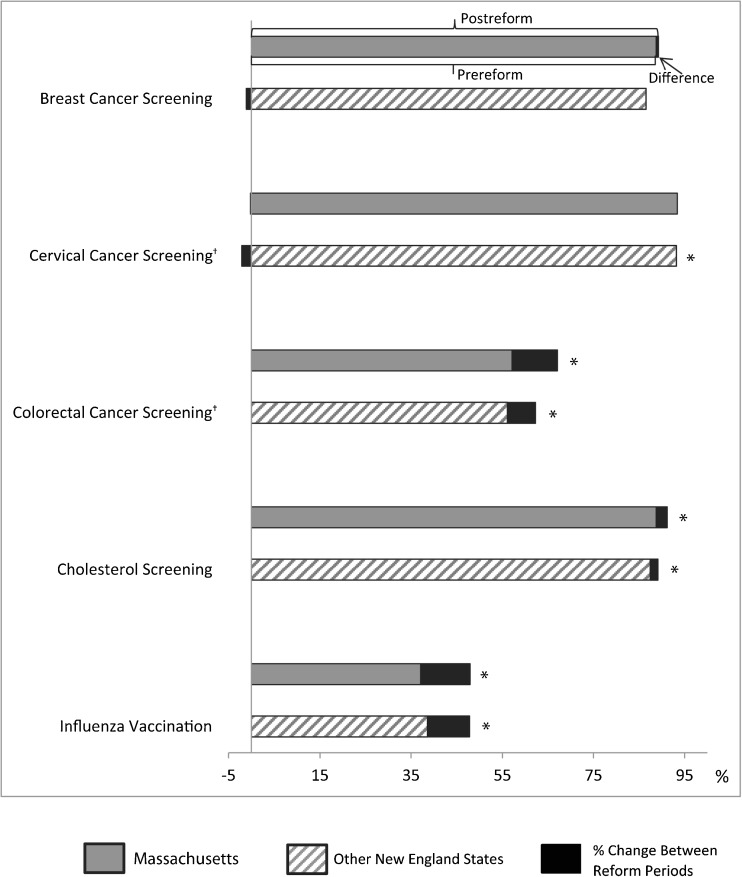
Figure 2.
Adjusted prevalence estimates of clinical preventive services and change between pre-reform (2002–2005) and post-reform (2007–2010) periods. *p <0.001. †Statistically significant difference in adjusted prevalence between post-reform and pre-reform years in Massachusetts minus that difference in other New England states (p <0.05).

