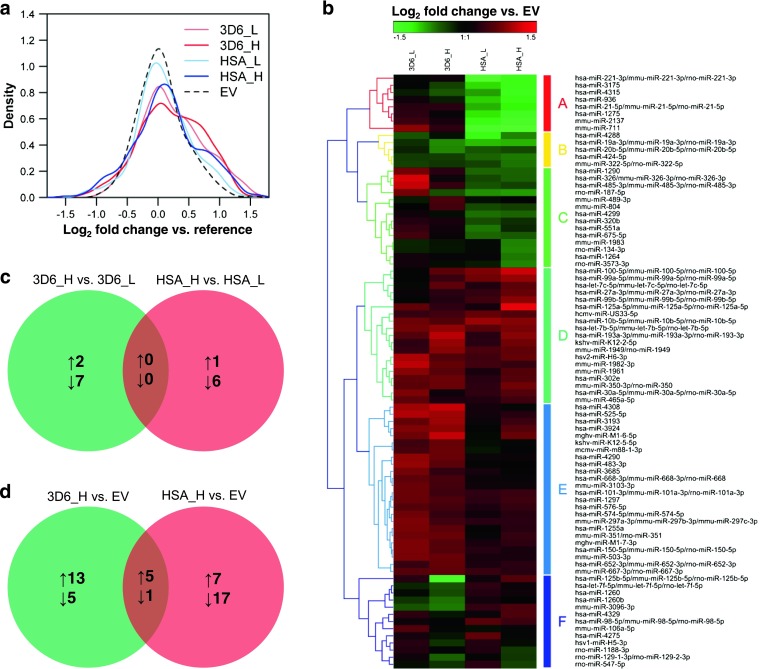
Fig. 3.

Comparative microRNA profiling using microarray analysis. Total RNA samples of five CHO cells lines from steady-state cultivations (n = 3) were analyzed. 3D6_L, CHO 3D6scFv-Fc low producer; 3D6_H, CHO3D6scFv-Fc high producer; HSA_L, CHO HSA low producer; HSA_H, CHO HSA high producer; EV, CHO empty vector (non-producer). a Density plot of the log2 fold change miRNA expression between each cell line and a common reference pool (mean values, n = 3). b Hierarchical clustering of 83 significantly differentially expressed mature miRNAs (adj. p < 0.05 and fold change > 1.5) based on log2 fold changes between producers and non-producer. Commonly and exclusively upregulated or downregulated miRNAs were determined using Venn diagrams. The number of significantly differentially expressed miRNAs of c 3D6scFv-Fc high producer versus 3D6scFv-Fc low producer and HSA high producer versus HSA low producer and d 3D6scFv-Fc high producer versus non-producer and HSA high producer versus non-producer are illustrated. upward arrow upregulated, downward arrow downregulated
