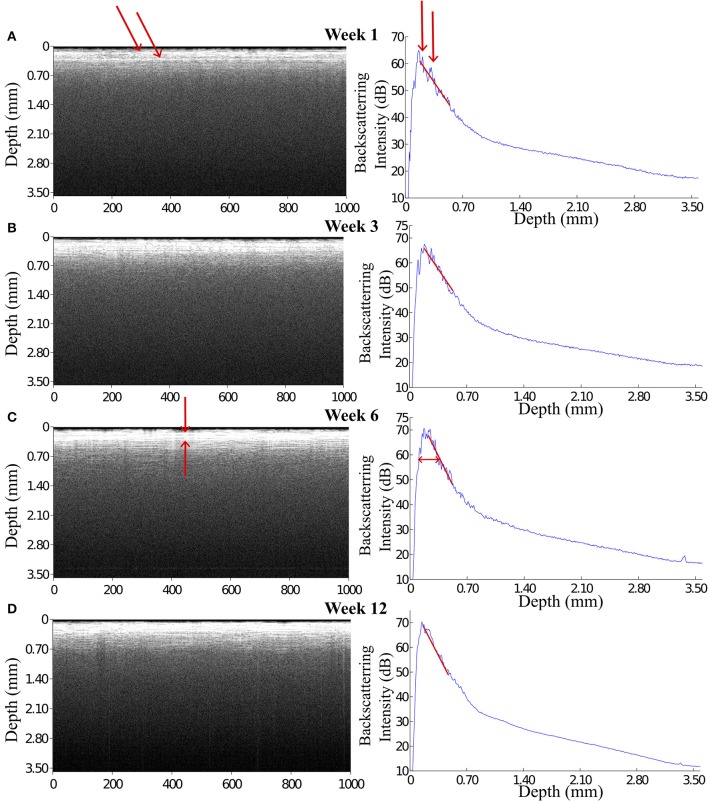
Figure 4.
OCT images and the corresponding A-scan profiles acquired at week 1, 3, 6, and 12 after implantation. The intensity of the backscattered light increased during the first 3 weeks post implantation (A,B), while at week 6 and 12 the OCT signal attenuated faster featuring a steep declining slope in the A-scan plot (C,D). Arrows in panel (A) indicate the anatomic micro structures viewed by the OCT. Arrows in panel (C) indicate a 200 μm thick layer is expressed in the OCT signal.

