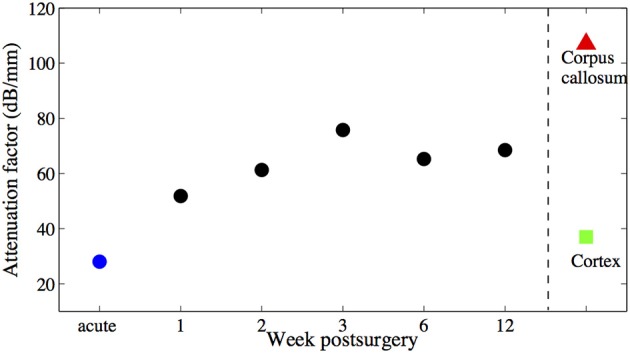
Figure 9.

Averaged attenuation factors of the brain tissue around the fiber catheter at week 1, 2, 3, 6, and 12 are marked with black •, attenuation factor obtained from acute experiment is marked with blue •. Attenuation factors of other brain tissue types obtained also in acute experiments (Xie et al., 2013) are marked with ∆ and □ respectively. No error bars are shown, due to the littel number of animals used.
