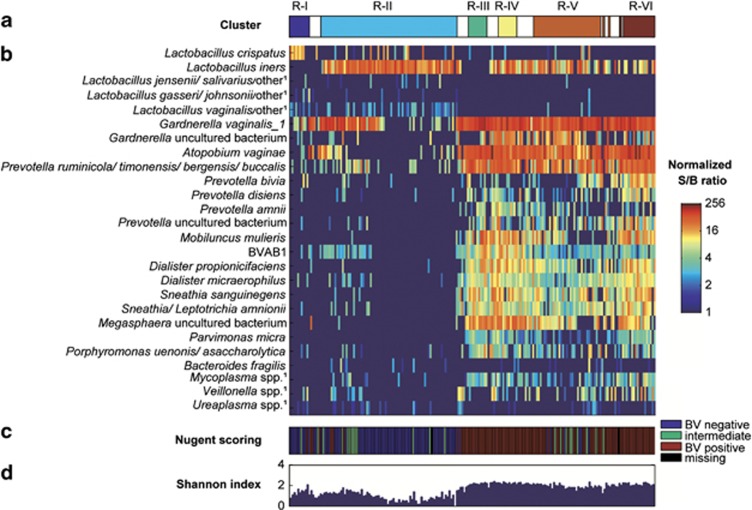
Figure 3.
Bacterial composition of the microbiome clusters. (a) shows the six clusters obtained by Neighborhood Co-regularized Multi-view Spectral Clustering of microarray data. The white spaces between the clusters represent samples with less than 70% probability of belonging to a cluster. (b) Heatmap, showing normalized S/B ratios on a log2 logarithmic scale of the most abundant species/genera per cluster, as well as species/genera that have traditionally been associated with BV and have been frequently reported in the literature. (c) BV-status of the women by Nugent score at the time of sampling. The color key is on the right. (d) The Shannon diversity index for each sample. 1Abbreviated probe name; additional targeted species in the same genus are listed in Supplementary Information.

