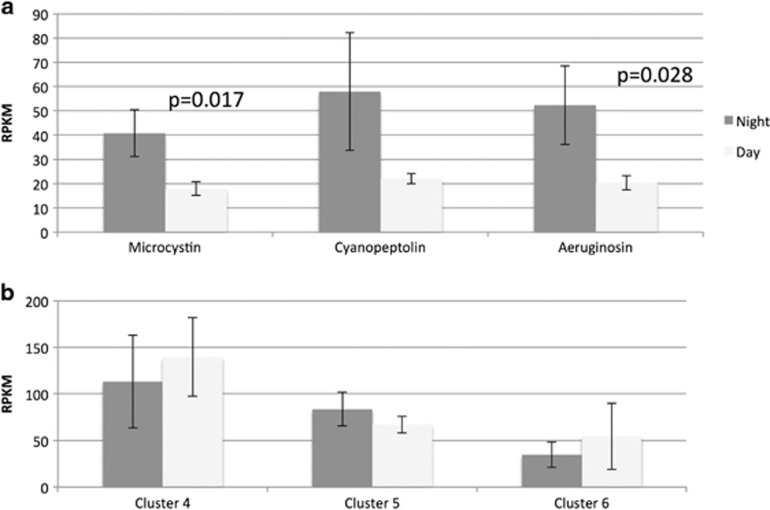
Figure 7.
Expression of secondary metabolite gene clusters, (a) clusters with a known product, (b) clusters that are not linked to a specific product. The error bars indicate 2 s.ds. from the mean. The P-values are for the test to reject null hypothesis that there is no difference between the mean night and day transcript abundance.

