Figure 5.
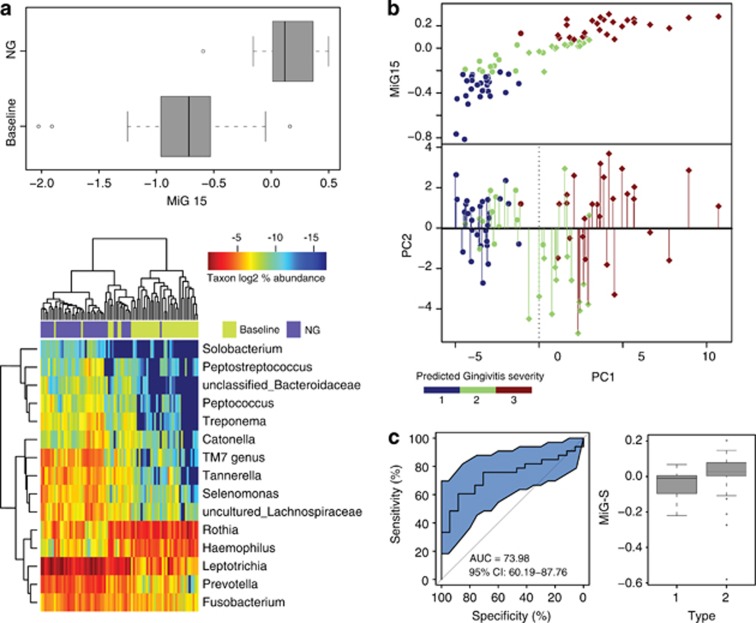
Trial prediction of disease outcome using Microbial Indices of gingivitis (MiGs). (a) The MiG15 indices of an additional cohort of 41 hosts. Boxes represented the interquartile range (IQR) and the lines inside represent the median. Whiskers denoted the lowest and highest values within 1.5 × IQR. The heatmap indicated the ability of MiG15 to discriminate healthy and gingivitis status of hosts. (b) Accuracy of MiG15-based prediction of disease severity in the additional cohort of 41 hosts. All samples in the test cohort were plotted on the first two principal components of the genus profile (point shape of individuals determined to have the same time point: circle: baseline; diamond: NG). Categorization of the actual and predicted PC1 values into three quantiles (blue: 1st quantile; green: 2nd quantile; brown: 3rd quantile) revealed an error rate of prediction at 24.4%. Color of each point showed its predicted PC1 value (that is, nth quantile), while color of the line connected to the point indicates its actual PC1 level (nth quantile). (c) Use of MiG-S to predict the gingivitis-sensitivity type for each host in the 50-member cohort during NG. The accuracy of MiG-S was measured by AUC, which was the area under the receiver operating characteristic (ROC) curve of plaque microbiota-based (that is, MiG-S-based) gingivitis-sensitive host-type classification. The black bars denoted the 95% CI and the blue area between the two outside curves represented the 95% CI shape. The MiG-S index was computed for each host.

