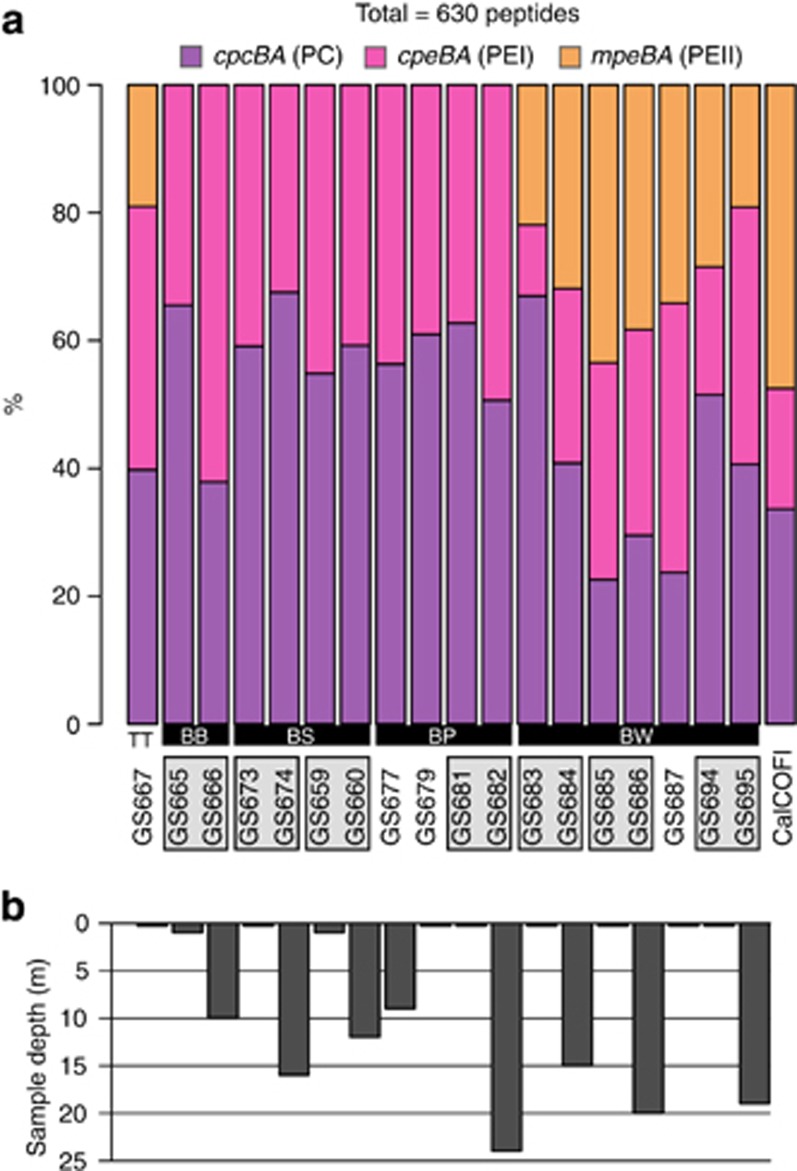
Figure 3.
Proportions of PBS genes. (a) Distribution of PC (cpcBA), PEI (cpeBA) and PEII (mpeBA) subunit genes in the metagenomic data set. The number of genes was normalized against the picocyanobacterial RecA protein and the graph shows the (normalized) relative proportion of each PBS subunit type at each site in the Baltic Sea metagenomic transect. The subbasin/location for samples is indicated by the abbreviations in the lower margin: BB, Bothnian Bay; BS, Bothnian Sea; BP, Baltic Proper; BW, Baltic West; C=CalCOFI (west coast of California); TT, Lake Torne Träsk. (b) Sampling depth at each site.

