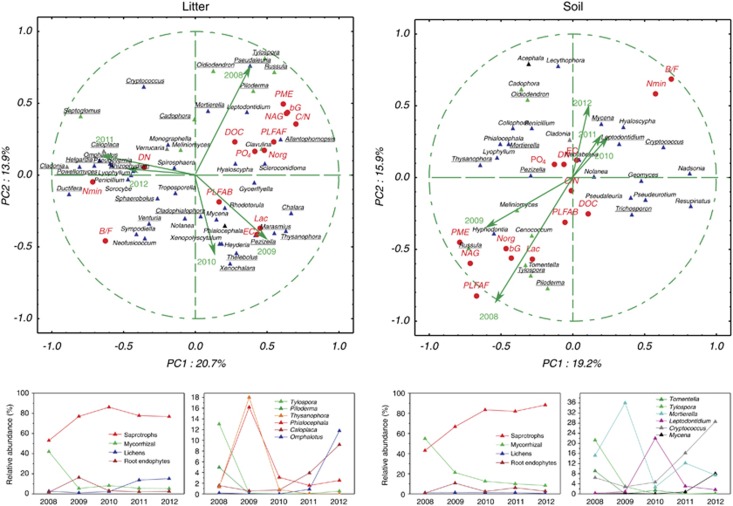
Figure 4.
Principal component analysis of the relative abundances of fungal ITS sequences corresponding to dominant fungal genera in the litter and soil of a P. abies forest before and after a tree dieback caused by a bark beetle invasion. Sampling season loadings and environmental variables are indicated. All genera with ⩾0.5% abundance in ⩾3 samples were considered. Fungal genera with significant differences in abundance among years are underlined. Root symbiotic fungi are indicated in green, root endophytes in black and lichens in gray. DN, dissolved N; C/N, C/N ratio; bG, β-glucosidase; EC, endocellulase; Lac, laccase; NAG, N-acetylglucosaminidase; PME, phosphatase; PLFAB, bacterial PLFA; PLFAF, fungal PLFA; B/F, bacterial/fungal biomass ratio. Bottom panels show relative abundances of ecophysiological groups of fungi and selected fungal genera; data represent means (standard errors omitted for clarity).

