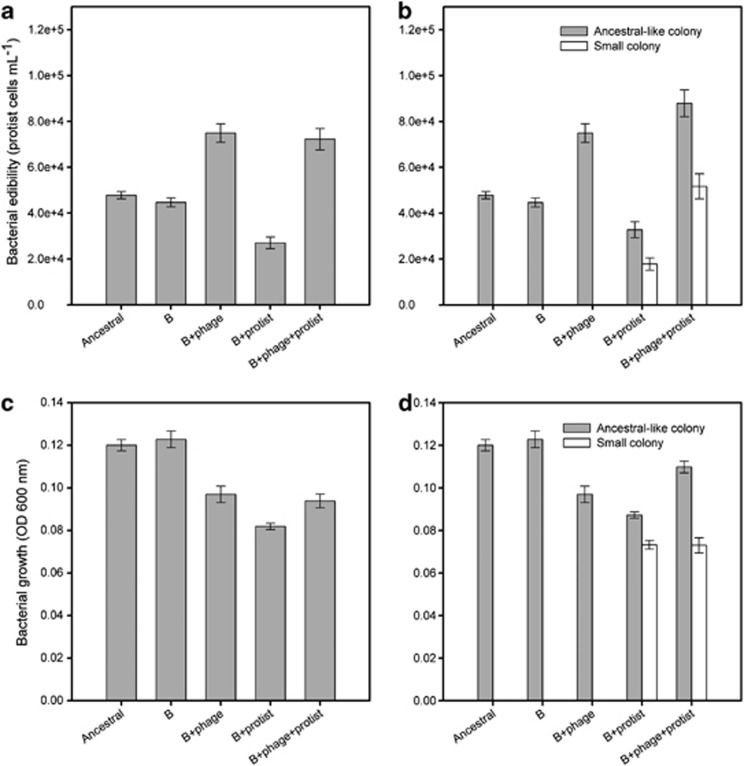
Figure 2.
Bacterial edibility (i.e., defence) for protist (a and b) and bacterial growth in the absence of enemies (c and d) between ancestral (A), bacterium-alone (B), bacterium–phage (B+phage), bacterium–protist (B+protist) and bacterium–phage–protist (B+phage+protist) treatments. Panels (a and c) show differences at the level of treatments (means of 12 colonies per replicate; means of five independent replicates per treatment, N=5), and panels (b and d) at the level of colony types within treatments (means of small and ancestral-like colony types per replicate; five independent replicates per treatment). Twelve measurement replicates were used for the ancestor (A). Error bars in all panels denote ±1 s.e.m.

