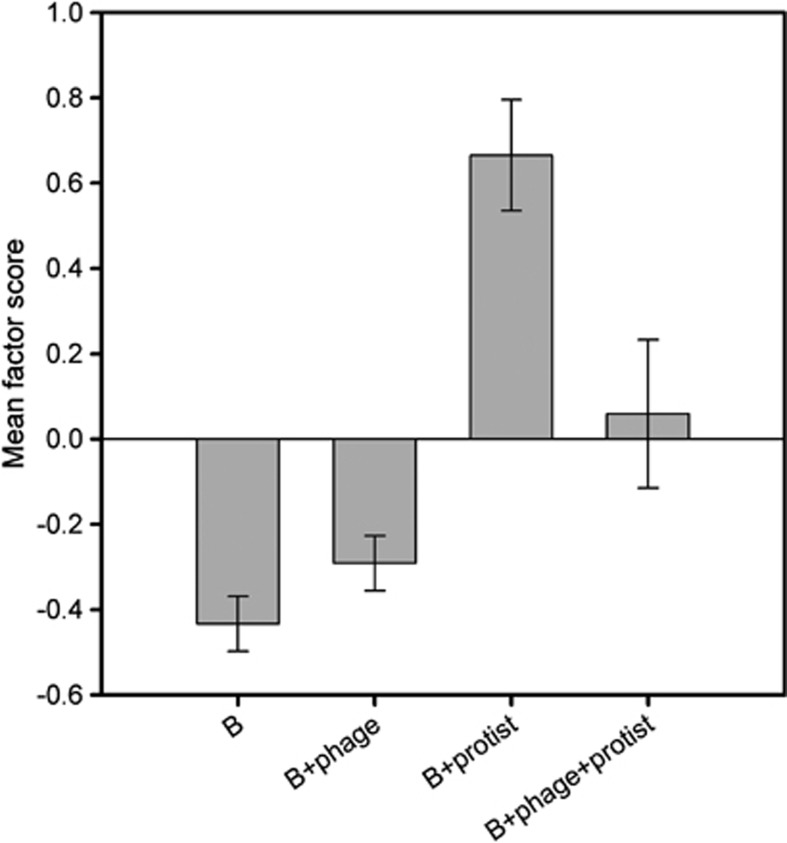
Figure 4.
Bacterial mean scores for defence factor between bacterium-alone (B), bacterium–phage (B+phage), bacterium–protist (B+protist) and bacterium–phage–protist (B+phage+protist) treatments (factoring is based on trait values of 12 independent colonies per replicate per treatment resulting in 240 individual colonies). The positive factor loadings denote for small colony types that form lots of biofilm, are relatively inedible to protists and show reduced growth. The negative factor loadings denote ancestral-like colony types that form little biofilm, are relatively edible to protists and grow well. Error bars denote ±1 s.e.m.

