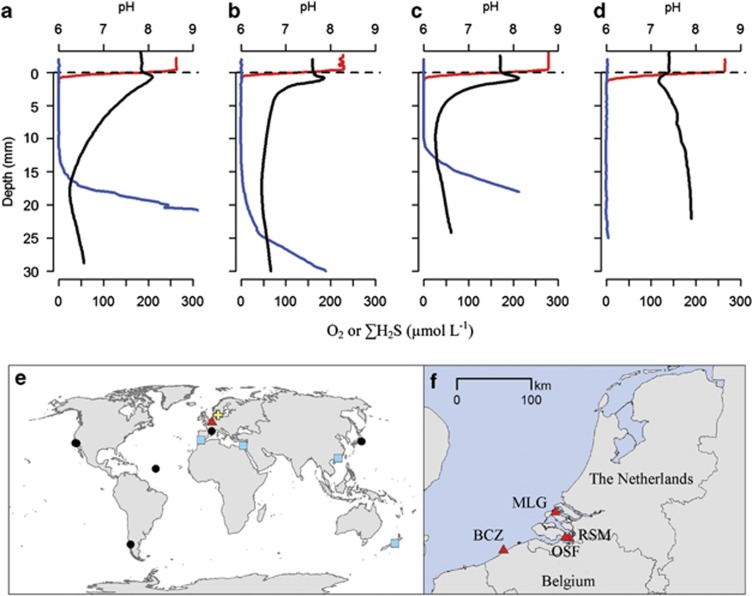
Figure 1.
Microsensor depth profiles of O2 (red), ΣH2S (blue) and pH (black) show the characteristic biogeochemical fingerprint of electrogenic sulphur oxidation in surface sediments from three coastal sites in the North Sea: (a) RSM, (b) BCZ and (c) MLG. In contrast, microsensor depth profiles from (d) OSF do not show the characteristic fingerprint. Representative microprofile curves are illustrated. (e) World map indicating Aarhus Harbour, the location where the electrogenic signature and Desulfobulbaceae filaments were first found in laboratory incubations (yellow cross), and the present study region (Dutch Delta area; red triangle). (f) Detailed map of individual study site locations (red triangles); full site details are given in Table 1. The world map also indicates locations where the geochemical signature of long distance electron transport have been found in literature reports (black circles) and locations where highly similar (⩾97%) 16S rRNA gene sequences to the Desulfobulbaceae filaments were retrieved from GenBank (blue squares); see Discussion for details.

