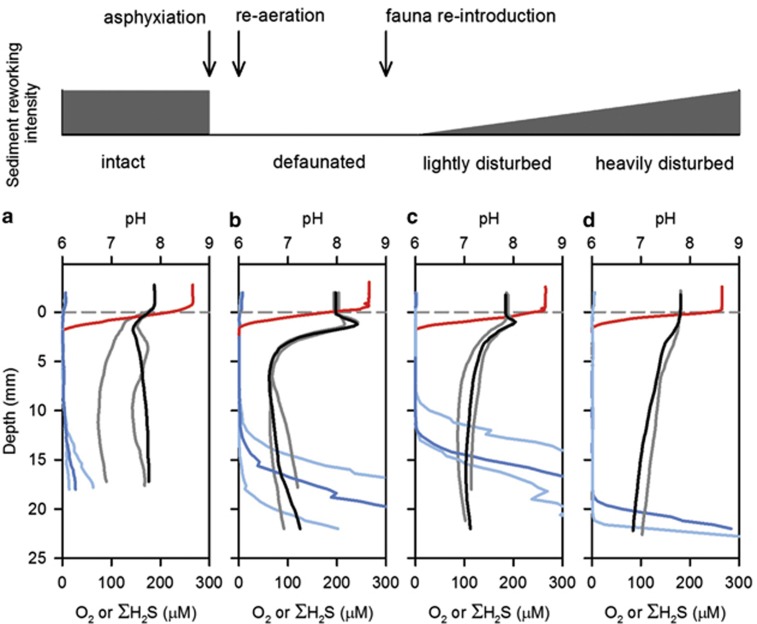
Figure 4.
Effect of sediment disturbance by fauna on electrogenic sulphur oxidation. Microprofiles of O2 (red), ΣH2S (blue) and pH (black and grey) are shown from sediment cores collected from the intertidal OSF. Different shades are used for replicate profiles for pH and ΣH2S for image clarity, whereas a single median profile is shown for O2. (a) Profiles from intact sediment cores. (b) Profiles from defaunated sediment cores. (c) Profiles from re-faunated sediment cores, in areas that were not visibly disrupted by mechanical disturbance caused by the re-introduced lugworms. (d) Profiles from re-faunated sediment cores, in areas that were not visibly disrupted by mechanical disturbance caused by the re-introduced lugworms.

