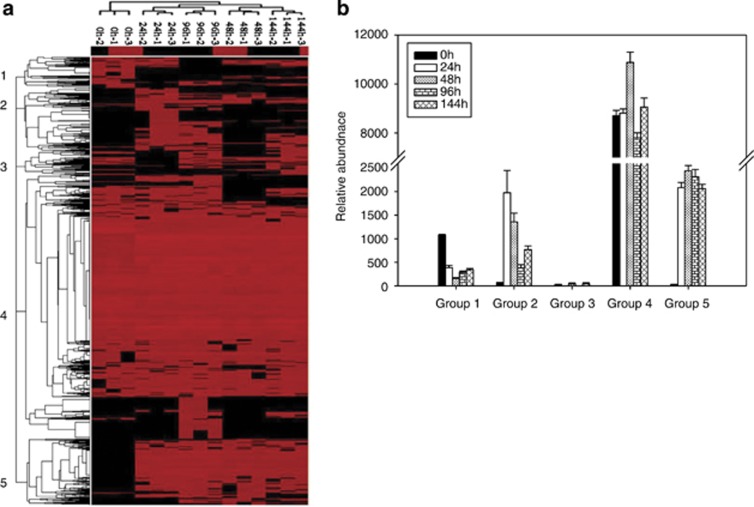
Figure 1.
Cluster analysis of functional genes detected using GeoChip 4.0. The figure was generated using CLUSTER and visualized in TREEVIEW (http://rana.lbl.gov/EisenSoftware.htm). Black indicates signal intensities below the threshold value, and red indicates a positive hybridization signal. The color intensity indicates differences in signal intensity. The samples from different sampling points were clearly separated. Five different gene patterns were observed and indicated by numbers in the tree (a), and they were represented as group 1 to 5 on axis x and the relative abundances of the gene signal intensity contained in different groups were presented on axis y in the graphs (b).

