Figure 1.
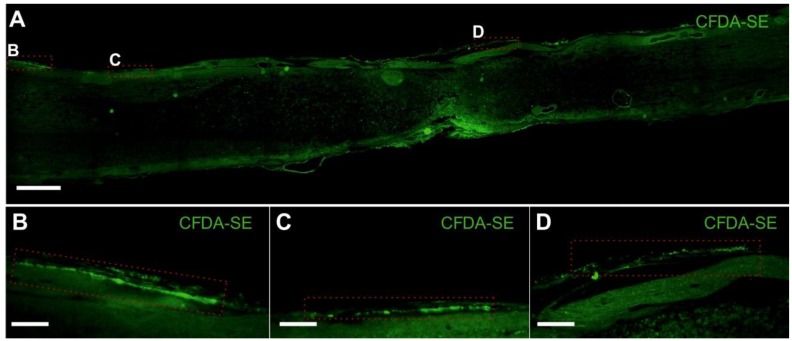
MSC survival and distribution one week after implantation. (A) Mosaic image of a longitudinal sectioned spinal cord with carboxy-fluorescein diacetate succinimidyl ester (CFDA-SE) labelled MSCs on the dorsal surface; (B–D) Cells attached to the spinal cord surface. Scale bars (A) 500 µm, (B–D) 100 µm.

