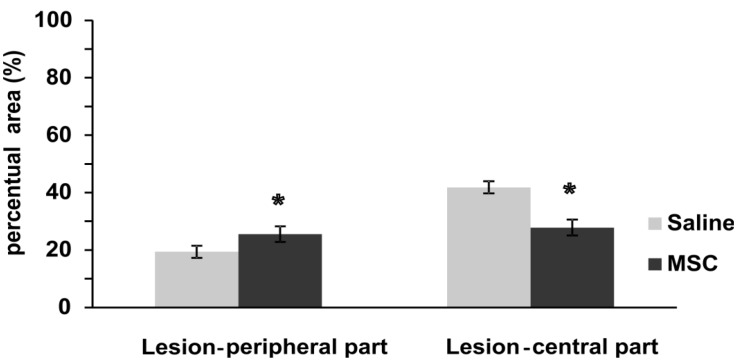
Figure 5.
Astrogliosis after SCI. This graph depicts significant changes in the GFAP-positive area after MSC implantation. The control group showed a significantly higher signal in GFAP fluorescence in the central and lower parts in the peripheral area of the lesion center, when compared to the MSC-treated group. Statistical significance was marked with *, where p < 0.05.

