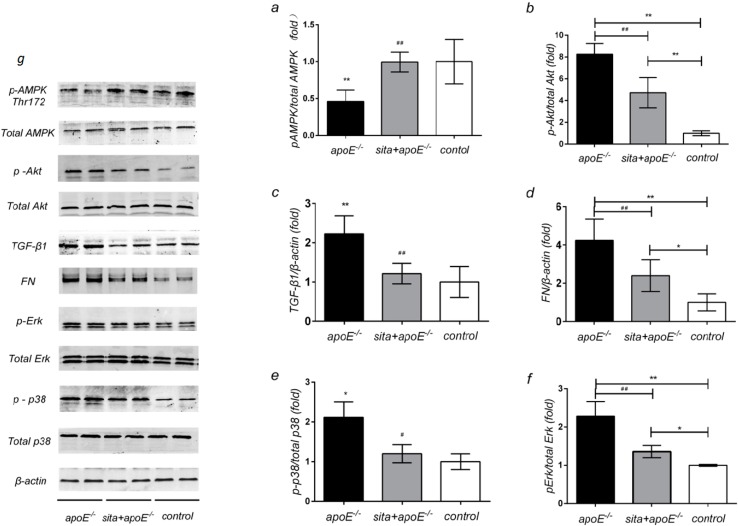
Figure 5.
Effect of sitagliptin on renal protein expression of AMPK, Akt, TGF-β1, FN and MAPK signaling pathway. Protein lysates (30 μg) from renal cortex were separated by SDS-PAGE and analysed by Western blotting. ApoE−/−, sita+ apoE−/− and control mice wereanalyzed for(a) phospho-AMPK/total AMPK; (b) phospho-Akt/total Akt; (c) TGF-β1/β-actin; (d) FN/β-actin; (e) phospho-p38/total p38; (f) phospho-ERK/total ERK levels. Values are means ± S.D. * p < 0.05 and ** p < 0.01 vs. control group, # p < 0.05 and ## p < 0.01 vs. apoE−/− group; (g) All the proteins were shown.

