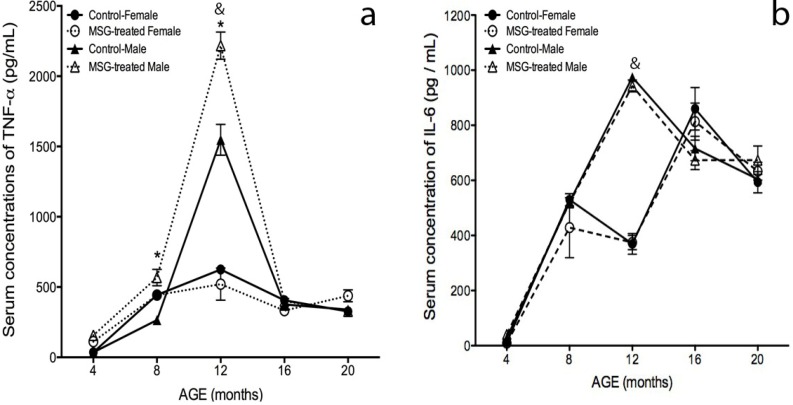
Figure 5.
Inflammatory profile in male and female MSG-treated mice. (a) TNF-α and (b) IL-6 serum levels were quantified by ELISA, as described in the Materials and Methods section at 4, 8, 12, 16 and 20 months of age. Plotted values were the mean ± S.E.M. for five mice per group. * p < 0.05 vs. control; & p < 0.05 MSG-treated female vs. MSG-treated male; ●, control female; ○, MSG-treated female; ▲, control male; ∆, MSG-treated male.

