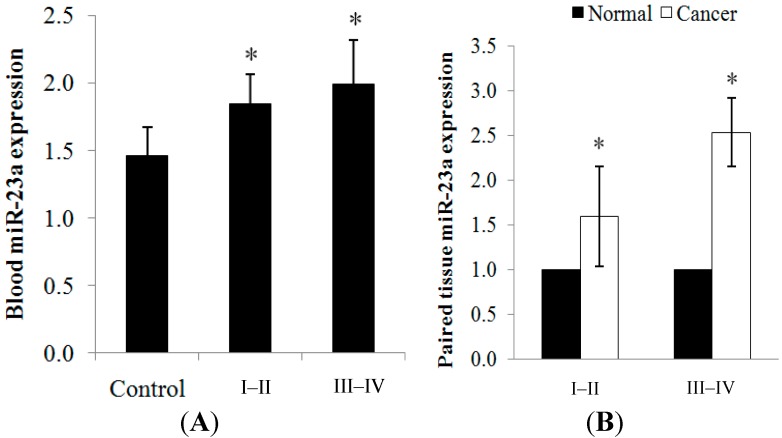
Figure 1.
(A) miR-23a expression was detected in the blood samples from healthy controls and CRC patients. An increasing trend of expression was observed as the cancer progressed from stage I–II to stage III–IV tumors; and (B) miR-23a expression was detected in the paired cancer tissues. Relative expression is expressed as fold change of cancer tissue versus adjacent normal mucosa. RNU48 was used as the endogenous control in the RT-qPCR analysis. Fold change above 1 indicates up-regulation. Data are presented as mean ± standard error of mean (SEM). * p < 0.05.

