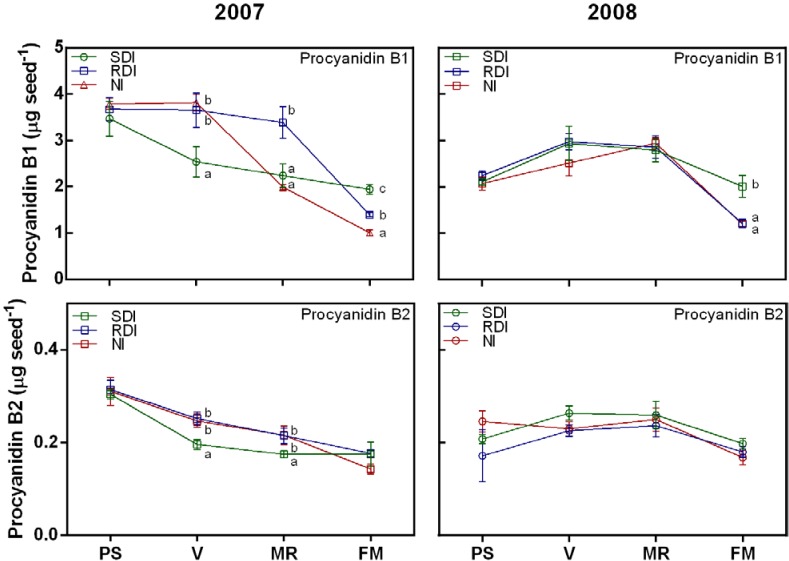
Figure 2.
Changes in proanthocyanidins during ripening of grape berry seeds in SDI, RDI and NI treatments during 2007 and 2008 seasons.Values presented are means ± SE (n ≥ 4). Different letters (a, b, c) indicate significant differences among treatments at the same date using Duncan’s test (p ≤ 0.05). PS: end of pea size (7 weeks after anthesis); V: veraison (9 weeks after anthesis); MR: mid-ripening (11 weeks after anthesis); and FM: full maturation (13 weeks after anthesis).

