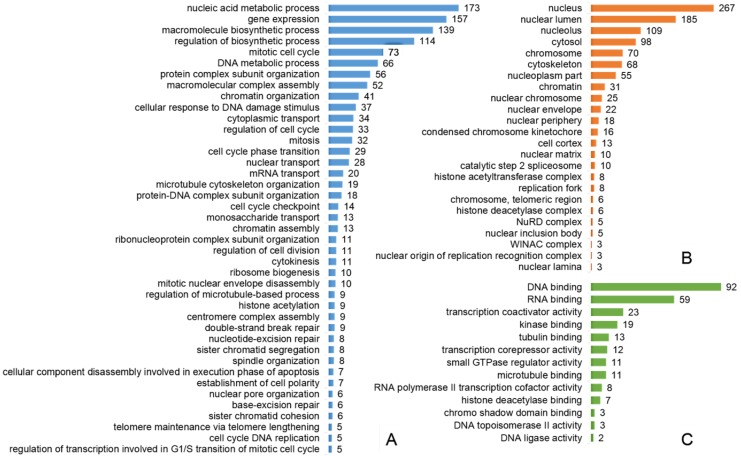
Figure 2.
Selected results of Gene Ontology terms over-representation analysis (FDR < 0.01): (A) Overrepresented Gene Ontology (GO) Biological process level 4 terms; (B) Overrepresented GO Cellular component level 4 terms; (C) Overrepresented GO Molecular function level 4 terms. x-axis contains the number of proteins involved in a particular pathway that were found differentially phosphorylated in our study.

