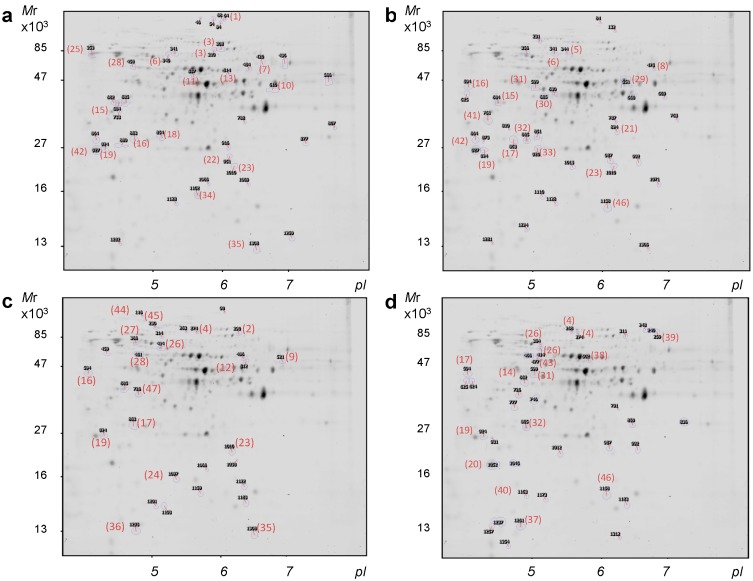
Figure 1.
Representative phosphoproteome map showing the proteins with significant changes (a) in the S. cerevisiae W303-1A haploid strain after treatment with cisplatin; (b) in the W303-1A-derived Δsky1 mutant after treatment with cisplatin; (c) in the W303-1A strain versus its Δsky1 mutant; (d) in the W303-1A strain versus its Δsky1 mutant, after treatment with cisplatin. Proteins were resolved in the 3–11 (nonlinear) pH range in the first dimension and on 12% acrylamide gels in the second dimension. Proteins identified by MALDI (Matrix-assisted laser desorption/ionization)-TOF (Time of Flight)/TOF mass spectrometry are listed in Table 1, where ID numbers correspond to the numbered spots in this figure (red numbers in brackets).

