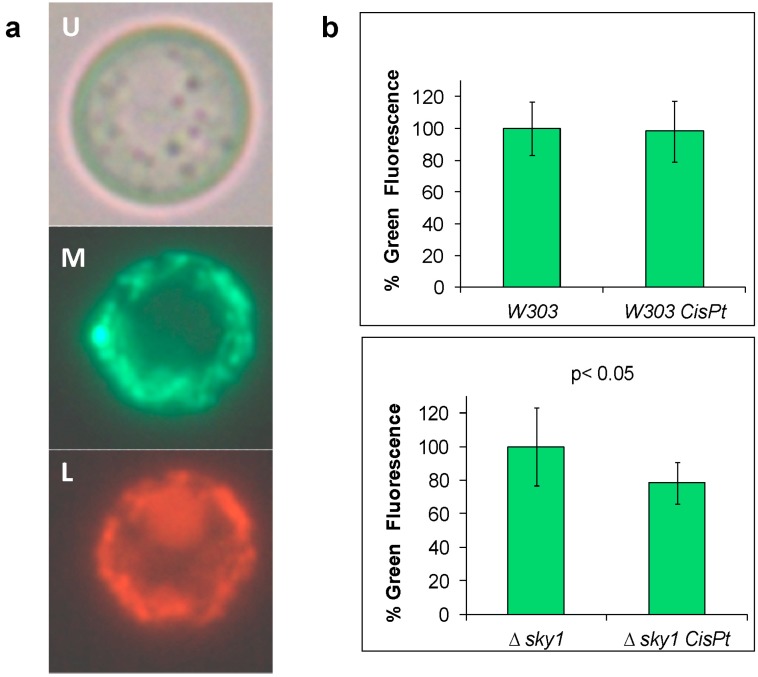
Figure 4.
Mitophagy in W303-1A (W303) and ∆sky1 strains after cisplatin (cisPt) treatment. (a) Visualization (objective 100×) of mitophagy in W303 cells treated with 1200 µM cisplatin; U, Bright field; M, Green channel for phluorin; L, Red channel for the Ds. Red T3 protein; (b) Quantification of the green fluorescence.

