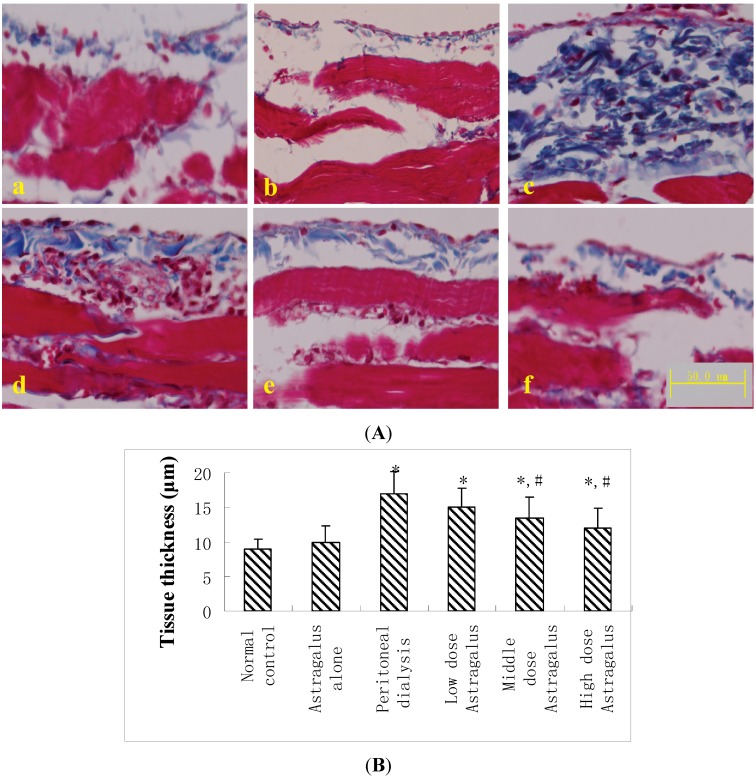
Figure 2.
(A) Micrograph of Masson’s trichrome staining of the diaphragmatic peritoneum of the normal control (a); Astragalus alone (b); peritoneal dialysis (c); Astragalus low dose (d); Astragalus middle dose (e); and Astragalus high dose groups (f); (B) The submesothelial tissue thickness was measured in the diaphragm. Mean ± SEM. * p < 0.05 compared to the normal controls; # p < 0.05 compared to peritoneal dialysis.

