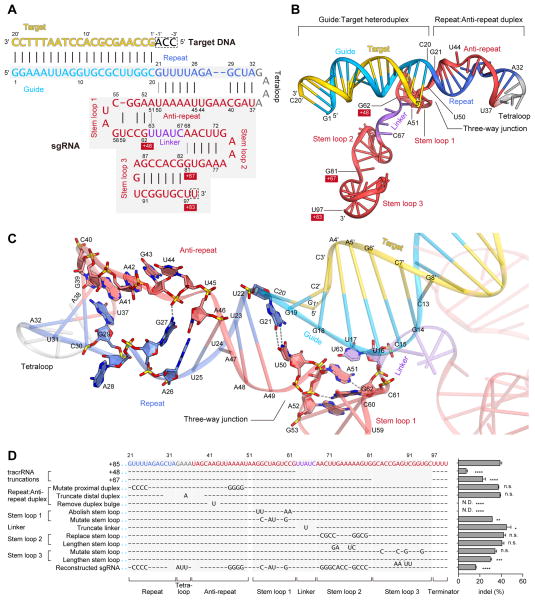
Figure 4. sgRNA and its target DNA.
(A) Schematic representation of the sgRNA:target DNA complex. The guide and repeat regions of the crRNA sequence are colored sky blue and blue, respectively. The tracrRNA sequence is colored red, with the linker region colored violet. The target DNA and the tetraloop are colored yellow and gray, respectively. The numbering of the 3′ tails of the tracrRNA is shown on a red background. Watson-Crick and non-Watson-Crick base pairs are indicated by black and gray lines, respectively. Disordered nucleotides are boxed by dashed lines.
(B) Structure of the sgRNA:target DNA complex.
(C) Close-up view of the repeat:anti-repeat duplex and the three-way junction. Key interactions are shown with gray dashed lines.
(D) Effects of sgRNA mutations on the ability to induce indels. Base changes from the sgRNA(+85) scaffold are shown at the respective positions, with dashes indicating unaltered bases (n = 3, error bars show mean ± S.E.M., p values based on unpaired Student’s t-test, N.D., not detectable).
See also Figure S6.

