Figure 1.
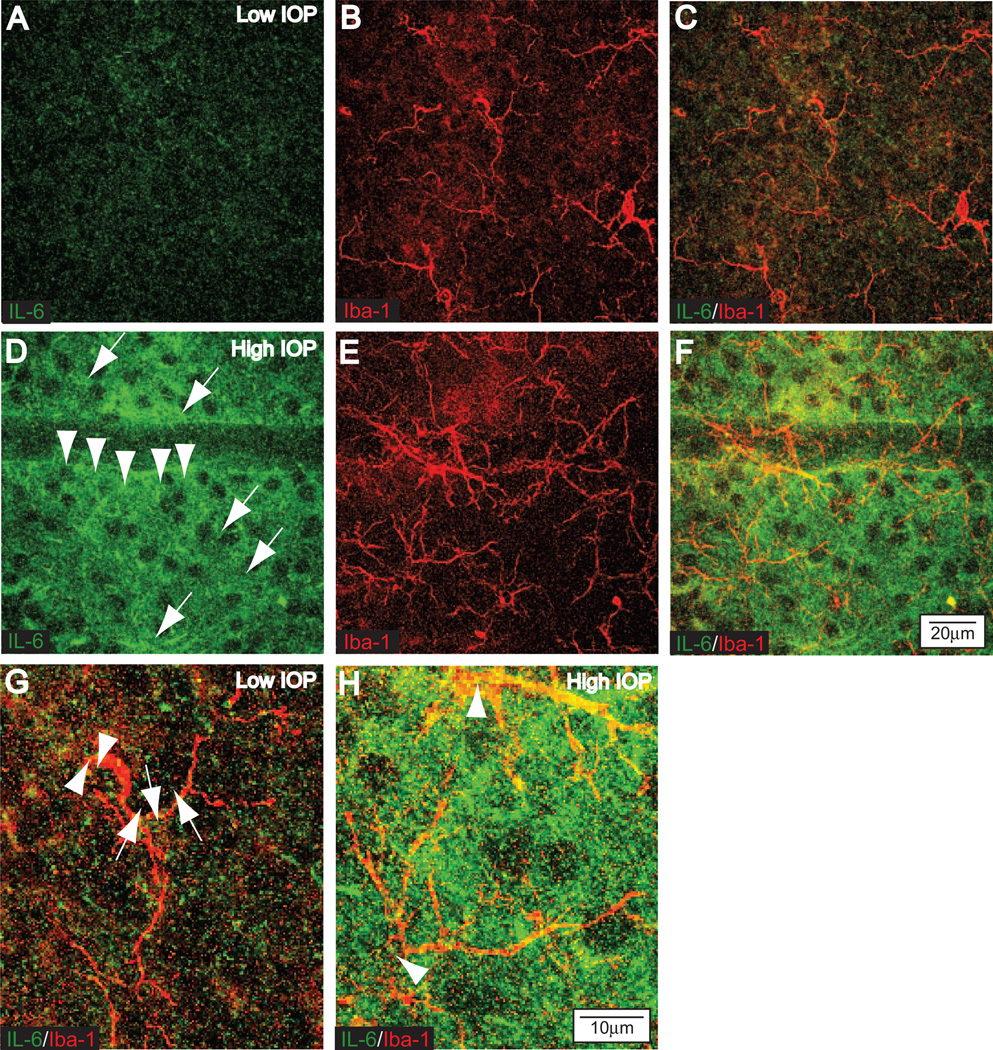
IL-6 Increases with elevated IOP in the DBA/2 mouse model of glaucoma. Confocal micrographs through the ganglion cell layer of 6-month-old DBA/2 retinas immuno-labeled for IL-6 and the microglia-specific marker Iba-1. Retina from eyes with relatively low IOP (average, 14.7 mm Hg; A–C) or higher IOP (average, 21.2 mm Hg; D–F). (A) Modest level of extracellular IL-6 in the ganglion cell layer of a retina with low IOP. (B) Several microglia in the same focal plane labeled by Iba-1. (C) Overlay of IL-6 and Iba1 reveals a low level of colocalization (yellow) associated mainly with microglial processes. (D) Stronger IL-6 labeling in retina with elevated IOP is concentrated in the extracellular space surrounding RGC cell bodies (arrows) and in cellular processes near RGCs (arrowheads). (E) Iba-1 labeling in the same field reveals hypertrophic microglial processes and an increase in ramification (compare with B). (F) Overlay reveals increased colocalization (yellow) of IL-6 and Iba-1, primarily in the processes of microglia. Scale is the same for (A–F). (G) Higher magnification of Iba-1 and IL-6 labeling shown in (C) demonstrates colocalization in microglia cell bodies (arrowheads) and processes (arrows). (H) Higher magnification of (F) reveals even stronger colocalization with increased IOP. Microglia cell bodies are indicated (arrowheads). Scale is the same for (G, H).

