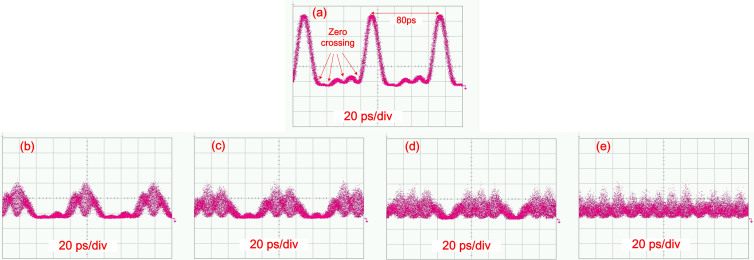
Figure 5. Time-domain waveform and the multiplexing process of the 62.5GBaud Nyquist signal.
(a) is the Sinc-shaped Nyquist pulses of 5 × 12.5 GHz combs; (b) ~ (e) show the process of 62.5GBaud Nyquist QPSK signal multiplexing. There are 2, 3, 4, and 5 branches Nyquist signals in Figs. 5 (b), (c), (d) and (e), respectively. In the measurement, the pulse waveforms are measured after one EDFA and the input power of oscilloscope is keep at one fixed value for protection, thus the pulse amplitude shows weaker as more pulses added. The pulse amplitude of the figure 5 (a) is measured before modulation and multiplexing, thus the power is larger than other figures. Additional insertion loss is added after modulation and multiplexing.

