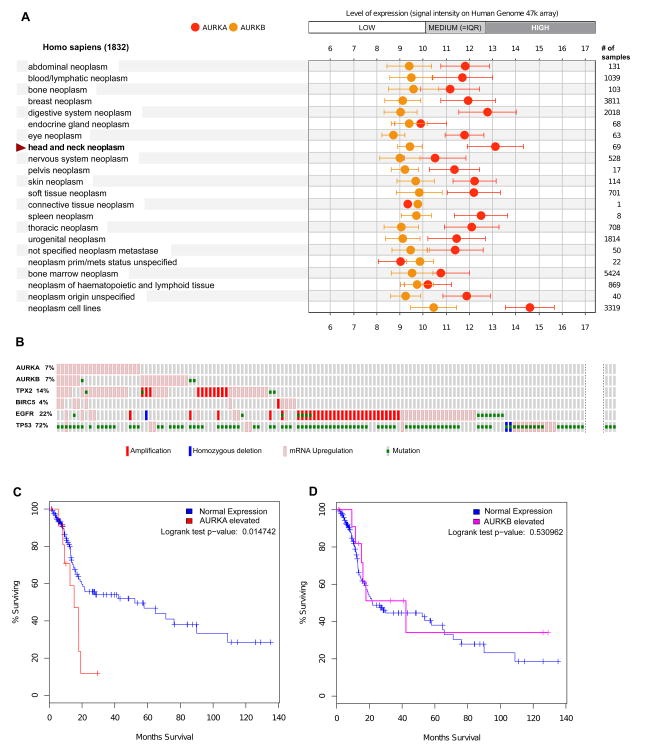
Figure 2. Expression and mutational profile of Aurora proteins in SCCHN tumors.
A. Publicly available microarray data from the Gene Expression Omnibus (GEO) [51] and ArrayExpress (http://www.ebi.ac.uk/arrayexpress/) databases were used by Genevestigator portal https://genevestigator.com/[52] to generate expression meta-profiles, which make data highly comparable between different experiments. Expression levels of Aurora-A (AURKA) and Aurora-B (AURKB), and other genes noted in the text across a range of cancer types were plotted using Genevestigator software. X-axis, log2 scale. B. Analysis of the Head and Neck Squamous Cell Carcinoma subset of TCGA data[53] (from a provisional release of 310 samples) were analyzed using the cBio portal. [54] The displayed Oncoprint, generated by the cBio portal, shows individual samples as vertical columns, with the alterations on each gene as shown in the graphic legend embedded in the figure: not all specimens with only mutated p53, or with no mutations, are shown. High gene expression is defined as having a z score >2 based on reference (matched normal) sample population. IQR, interquartile range (defines expression of 25-75% of all genes) C. Kaplan-Meier plot comparing survival for high and low expression cohorts in regard to Aurora-A and Aurora-B, based on TCGA data.

