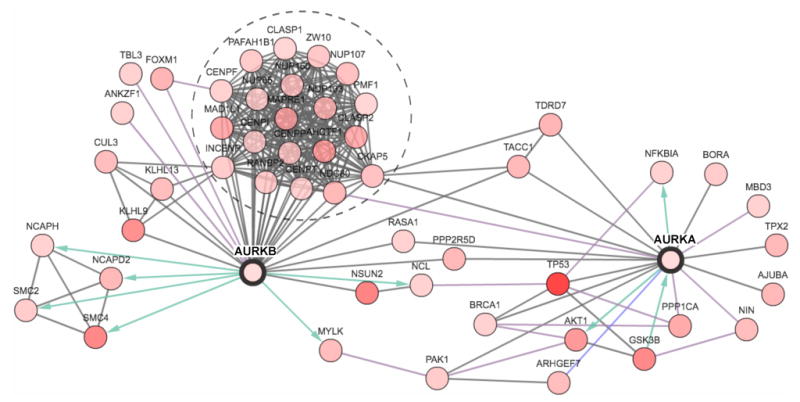
Figure 3. A SCCHN network for Aurora-associated proteins.

A network was generated around the Aurora-A (AURKA) and Aurora-B (AURKB) proteins was generated by the cBio portal [54] using data from Pathway Commons regarding protein-protein (HPRD), enzymatic (Reactome ) and pathway (NCI-Nature Pathway Interaction Database) interactions. Of all neighbors of the seed genes (AURKA & AURKB), the 50 most frequently altered in the SCCHN subset of TCGA data are shown. All proteins are identified by official gene symbol. Node coloring (white to red: low to high) reflects the combined frequency of all alterations for a given gene. Blue and green arrows represent enzyme-substrate interactions. The group of proteins circled by a dashed line represents a large group of coordinately regulated proteins found in a mitotic complex with Aurora-B at the centromere/kinetochore. Detailed information (i.e., copy number alterations, expression change, frequency of mutations) can be viewed for each gene in a network generated for AURKA and AURKB on http://www.cbioportal.org/.
