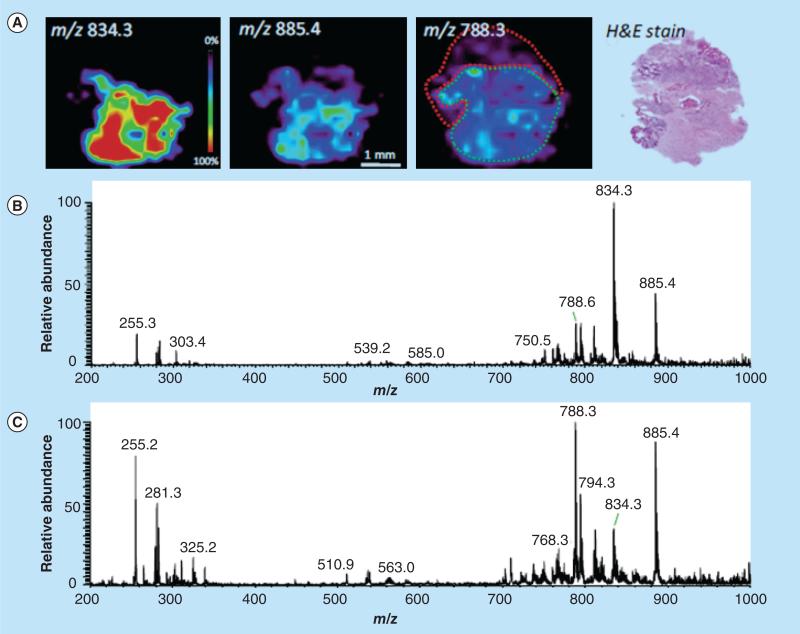
Figure 2. Desorption electrospray ionization-MS imaging of surgical sample, astrocytoma grade IV, showing regions of heterogeneity as recognized by histopathological evaluation.
(A) Desorption ESI (DESI)-MS ion images showing the distribution of m/z 834.3, m/z 885.4 and m/z 788.3, and optical image of H&E-stained tissue section. DESI-MS spectra of (B) low tumor cell concentration region infiltrating into gray matter (delineated in green in the same ion image) and (C) dense tumor region (delineated in red in the m/z 788.3 ion image), with high tumor cell concentration.
H&E: Hematoxylin and eosin.
Reproduced with permission from [30].

